














Bitcoin and Gold. Source: Techgaged/Shutterstock.

The Bitcoin-gold relationship just hit a new extreme. Their 90-day rolling correlation climbed to its highest level since 2020, according to Bitwise’s Weekly CIO Memo, published September 2, 2026.
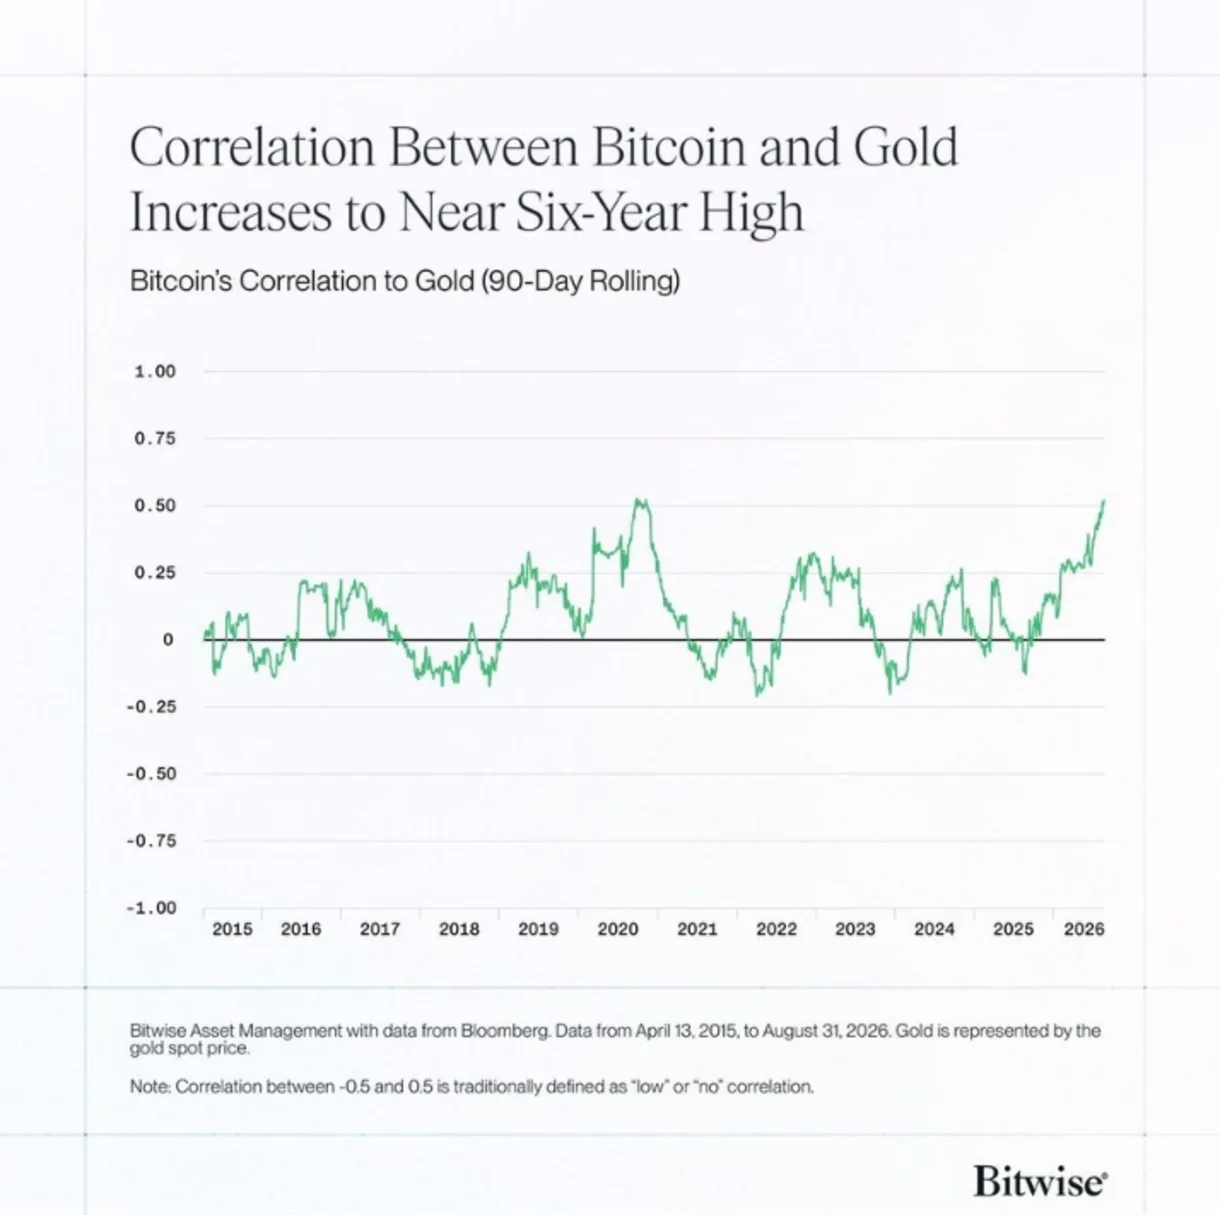
That’s the same territory last seen during the Covid stimulus era.
What Changed So Fast
The shift came during a rough stretch for bonds. Long-dated Treasury yields moved sharply higher.
Latest Stories

Crypto’s Leadership Is Shifting — Privacy Tokens Are Now in Front

BitMine’s Biggest ETH Buy in Two Months Brings It Closer to a Major Milestone

$1 Billion in SOL Bought in Less Than a Year — Bitwise Isn’t Slowing Down
Treasury Secretary Scott Bessent responded by expanding the government’s long-dated bond buybacks.
Bitcoin rose 22.4% the following week. That’s its strongest weekly gain since March 2024.
Gold climbed about 5% over the same stretch. Stocks fell. Both hard assets moved together while equities went the other way.
Techgaged tracked a related setup back in February, when Bitcoin’s ratio against gold sat near 2022 bear market levels, with gold sharply outperforming at the time.
The Bigger Rotation Story
Bitcoin’s correlation with the Nasdaq-100 dropped to a one-year low over the same period.
That weakens the case that Bitcoin simply trades as a tech stock proxy. Bitcoin also stayed negatively correlated with the US Dollar Index.
A weaker dollar has coincided with stronger Bitcoin and gold prices. Bitwise’s André Dragosch put it directly.
He said Bitcoin has started looking like an amplified version of gold when macro forces dominate the market.
Where the Chart Sits
The BTC/Gold ratio on TradingView traded at 18.10 as of 06:55 UTC on September 4, 2026, down 0.67% for the week.
The weekly MACD line reads 0.53683 against a signal line of -0.36944, with the histogram building green after a long stretch of red.
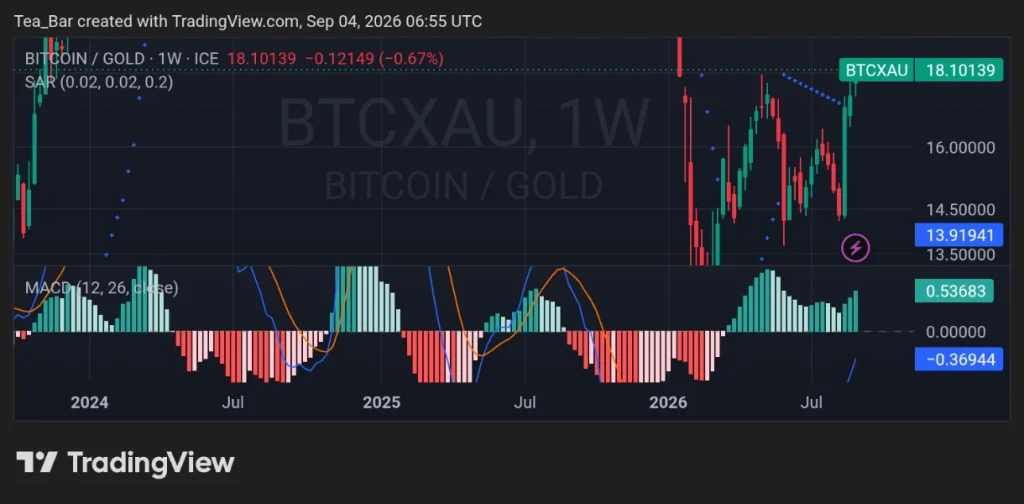
The weekly Parabolic SAR has flipped below price, a signal that typically favors continued strength in Bitcoin’s ratio against gold going forward.
That flip lines up with a shift Techgaged flagged in early March, when Robert Kiyosaki argued Bitcoin would follow gold’s rally after a sharp $128 single-day gold move.
A Reason for Caution
Not every analyst is convinced this holds. Glassnode noted that Bitcoin’s 30-day correlation with the S&P 500 also fell toward zero during the August rally.
Sudden decorrelations during bond selloffs have historically been short-lived. They’ve marked local exhaustion more often than a lasting regime shift.
Whether this correlation spike becomes a durable structural change or fades once bond markets settle down likely depends on what happens at the Fed’s September 16 rate decision, the next real test for this whole macro setup.
Disclaimer:
This article is for informational purposes only and does not constitute financial, investment, or trading advice. The views expressed are based on publicly available data, market observations, and the author’s interpretation at the time of writing. Cryptocurrency markets are highly volatile and unpredictable, and past performance or current technical setups do not guarantee future results. Readers should conduct their own research and consult with a qualified financial advisor before making any investment decisions. TechGaged does not accept liability for any losses incurred based on the information presented.
How do you rate this article?
Subscribe to our YouTube channel for crypto market insights and educational videos.






Join our Socials
Briefly, clearly and without noise – get the most important crypto news and market insights first.
Most Read Today
1
Tokenized Treasuries Hit $20B+: RWA Crypto Due Diligence for Investors
2$1 Billion in SOL Bought in Less Than a Year — Bitwise Isn’t Slowing Down
3Only Berkshire Hathaway Stands Above Strategy in This S&P 500 Ranking
4BitMine’s Biggest ETH Buy in Two Months Brings It Closer to a Major Milestone
5Crypto’s Leadership Is Shifting — Privacy Tokens Are Now in Front
Latest





8
Also read
Similar stories you might like.

Crypto News
Only Berkshire Hathaway Stands Above Strategy in This S&P 500 Ranking
Azeez | 2026-09-03

Crypto News
Bitcoin Is Decoupling From Equities in a Major Market Shift
Azeez | 2026-09-02
Crypto News
Strategy Buys Bitcoin Again After a Two-Month Pause
Azeez | 2026-09-01

Crypto News
Bitcoin’s Historic August Leaves One Big Question for Q4
Azeez | 2026-08-31

Crypto News
Three Major Signals Now Point to a New Bitcoin Bull Market
Azeez | 2026-08-30

Crypto News
Metaplanet Moves 3,000 BTC in 24 Hours — What Are They Planning?
Azeez | 2026-08-29
Crypto News
Strategy’s Bitcoin Bet Now Comes With Far Less Leverage
Azeez | 2026-08-28

Crypto News
U.S. Government Moves Part of Alameda BTC, Reviving Fears of a Major Liquidation
Azeez | 2026-08-27

Crypto News
Fidelity Clients Keep Buying Bitcoin As Nine-Day Streak Continues
Azeez | 2026-08-27

Crypto News
Bitcoin’s Next Big Test Emerges As $5B In IBIT Options Near Expiry
Azeez | 2026-08-26