











Hands arranging crypto tokens on dark desk

Open interest counts every futures or options contract still open on an exchange, and it rises only when a genuinely new position is created and falls only when one is closed. For crypto traders, it functions as a real-time gauge of capital committed to the market and, paired with price, one of the more reliable signals for whether a trend has conviction behind it or is running on fumes. The rest of this guide breaks down how it’s measured, how it differs from volume, and how to build it into a repeatable entry and exit checklist.
TL;DR:
Latest StoriesRead all latest stories → Solana’s Inflation Curve Gets a Major Overhaul After Community Vote
 Ethereum Faces One of Its Most Extreme Sell-Side Readings on Binance
 Chainlink Is Expanding Again — Here’s Where It’s Moving Next
- Open interest increases only when new contracts are created and remains unchanged during transfers between traders; it drops when positions close entirely.
- Rising open interest alongside rising price confirms new capital entering the market, while falling open interest with rising price suggests short covering rather than genuine bullish momentum.
- Volume measures daily trading activity and resets each period, whereas open interest is a cumulative indicator showing the total number of outstanding contracts.
- Large discrepancies in open interest data between exchanges or lagging updates can mislead traders, so cross-checking multiple sources is essential before acting.
- Concentration of open interest in a few large accounts heightens manipulation risks, and false signals often occur when open interest moves are driven by spoofing or liquidations.
What Open Interest in Crypto Means and How It’s Calculated
Open interest is the total number of outstanding futures or options contracts that haven’t been settled or closed, according to CME Group’s own education materials. Every contract has a buyer and a seller. When a new buyer and a new seller create a fresh contract, open interest goes up by one. When an existing holder closes their position by trading with someone also closing theirs, open interest drops by one. If one trader simply sells their existing contract to a different trader who is opening a new position, open interest stays flat, the trade just changes hands.
That distinction trips up a lot of newer traders, so it helps to see it laid out:
- Opening trade + opening trade = open interest increases.
- Closing trade + closing trade = open interest decreases.
- Opening trade + closing trade (a transfer) = open interest unchanged.
Crypto adds a wrinkle traditional futures don’t have. Bitcoin and Ether perpetual contracts get reported both in raw contract counts and in notional USD value, and coin-margined contracts (settled in BTC or ETH) get aggregated alongside stablecoin-margined ones using a conversion that varies by provider, per Coinalyze’s open interest data. On regulated exchanges like CME, positions also get split into reportable and nonreportable categories, and the CFTC’s Commitment of Traders explanatory notes summarize how concentrated large-trader positions actually are, which matters when a handful of accounts are driving most of the open interest in a contract.
Open Interest vs. Trading Volume: Why They Tell Different Stories
Volume and open interest measure two entirely different things, and mixing them up leads to bad reads on market strength. Volume counts every contract traded during a specific period, a day, an hour, whatever window you’re looking at, and it resets to zero at the start of the next period. Open interest is cumulative: it’s the running total of contracts still outstanding, regardless of how many times they’ve changed hands. Investopedia’s breakdown of open interest frames it plainly: rising open interest alongside rising price typically confirms a trend, while volume alone tells you nothing about direction.
You can see high volume with flat open interest fairly often. Imagine a session where 50,000 BTC perpetual contracts trade hands, but it turns out most of that activity is existing holders swapping positions with each other rather than new money entering. Volume spikes, open interest barely moves. That’s a position transfer, not new commitment.
A quick way to decide which metric to lean on:
- Use open interest when you want to know if new capital is entering or leaving a market.
- Use volume when you want to know how active trading is right now, regardless of net positioning.
- Use both together when you’re trying to confirm whether a price move has real conviction behind it.
Open interest also correlates with liquidity. Contracts with deep, sustained open interest tend to have tighter bid-ask spreads and absorb large orders without wild slippage. Thin open interest means the opposite: a single large order can move price several percentage points.
Reading Price and Open Interest Together: Four Rules and Their Traps
Four combinations of price and open interest cover most of what you’ll see on a chart, and they’ve been standard technical-analysis shorthand for decades, adapted from traditional futures markets and now widely applied to Bitcoin and Ether derivatives, per the open interest overview on Wikipedia.
- Rising price, rising open interest. New longs are entering aggressively. This is generally the strongest bullish signal because fresh capital is backing the move, not just existing positions getting marked up.
- Rising price, falling open interest. Short sellers are being squeezed and covering, pushing price up as they buy back contracts to close. The rally can be real, but it’s fueled by capitulation rather than new conviction, and it tends to lose steam once the squeeze exhausts itself.
- Falling price, rising open interest. Fresh shorts are piling in. This usually signals a strong, conviction-backed downtrend rather than a bounce setup.
- Falling price, falling open interest. Longs are giving up and closing positions. The drop reflects capitulation more than new bearish bets, and downside momentum often fades once most of the weak hands are out.
None of these rules work in isolation. Layer in volume to confirm participation, check funding rates to see whether longs or shorts are paying a premium to hold their position, and watch for liquidation clusters, which often mark the exact point where an open interest surge unwinds violently. Techgaged’s coverage of quiet derivatives markets ahead of a breakout is a good example of how contracting open interest can precede a volatility spike rather than confirm calm.
Pro Tip: Never trade the four-pattern rule off a single exchange’s number. Cross-check open interest against at least one other venue before assuming a squeeze or a fresh trend is underway. Concentration on one exchange can produce a signal that doesn’t hold up market-wide.
Watch for reporting lag, too. Some exchanges update open interest every few minutes; others batch it less frequently, so a chart that looks flat might just be stale.
Where to Find Open Interest Data and How to Check It’s Trustworthy
Exchange-native dashboards give you the cleanest number for that specific venue, contracts outstanding on Binance, OKX, or CME, with no aggregation guesswork involved. Aggregated services pull data across multiple exchanges into one chart, which is more useful for a market-wide read but introduces a layer of conversion and timing assumptions you need to account for. CoinGlass’s Bitcoin open interest dashboard is a widely used example of the aggregated approach, showing total OI alongside per-exchange breakdowns so you can see where positioning is concentrated.
Before trusting any feed, run through a short checklist:
- Check the last-updated timestamp, not just the headline number.
- Confirm whether OI is shown in raw contracts or converted USD notional, since the two can diverge significantly for coin-margined instruments.
- Note how many exchanges feed the aggregate, and whether one venue dominates the total.
- Look for a concentration flag showing if a handful of large accounts hold an outsized share of open positions.
Providers genuinely disagree with each other. One aggregator’s Bitcoin OI figure can sit noticeably higher or lower than another’s for the same hour, purely because of differing conversion methods or exchange coverage, a gap Coinalyze’s own data notes explicitly. Some platforms refresh every few minutes, but plenty of feeds lag well behind that, so treating a “live” number as truly live for scalping decisions is a common and avoidable mistake. Triangulating two or three sources before acting on a sharp OI move costs you thirty seconds and saves you from trading a data glitch.
A Four-Step Routine for Checking Open Interest Before You Trade
- Verify the source and timestamp. Confirm which exchange or aggregator you’re looking at and how recently it refreshed. A number from twenty minutes ago during a fast market is close to useless.
- Compare open interest against price and volume. Run the reading through the four-pattern rule above: is this a genuine trend confirmation, a squeeze, or a capitulation move?
- Check funding rates and recent liquidations. A spike in open interest paired with a sharp funding rate skew often precedes a liquidation cascade, one of the more reliable near-term risk signals in crypto derivatives.
- Size your position to the market’s depth. In low open interest contracts, cut your size down and widen your expectations for slippage. Skip the trade entirely if one exchange accounts for almost all the open interest in a thinly traded pair, since that concentration makes the number easy to distort.
Pro Tip: Treat a contract with open interest under a fraction of its 30-day average as effectively illiquid, regardless of what the price chart looks like. Thin OI markets can gap violently on a single large order.
How Open Interest Shapes Sentiment and Trader Behavior
Open interest functions as a visible scoreboard of conviction, and traders react to it almost as much as they react to price itself. When open interest climbs fast alongside a rally, it tends to draw in momentum traders who read the rising number as confirmation that “smart money” is committing capital, which can create a self-reinforcing cycle where rising OI attracts more participants, who push OI even higher.
The flip side shows up during sharp corrections. A rapid open interest drop during a selloff usually signals mass position closing rather than fresh conviction on either side, and seasoned traders often read that kind of unwind as a sign the market is closer to a local bottom than a continuation. Techgaged’s analysis of how rising optimism has coincided with slowing Bitcoin momentum illustrates this dynamic well, where derivatives positioning shifted well before spot price caught up.
There’s also a herding effect specific to crypto. Because open interest charts are public and widely shared across trading communities and social platforms, a sudden spike can itself become the headline, prompting retail traders to pile into a direction simply because the number is trending, independent of whether the underlying fundamentals support it. That feedback loop is part of why open interest surges near all-time highs so often precede outsized volatility in either direction, rather than smooth continuation.
Limitations and Manipulation Risks You Should Know Before Relying on Open Interest
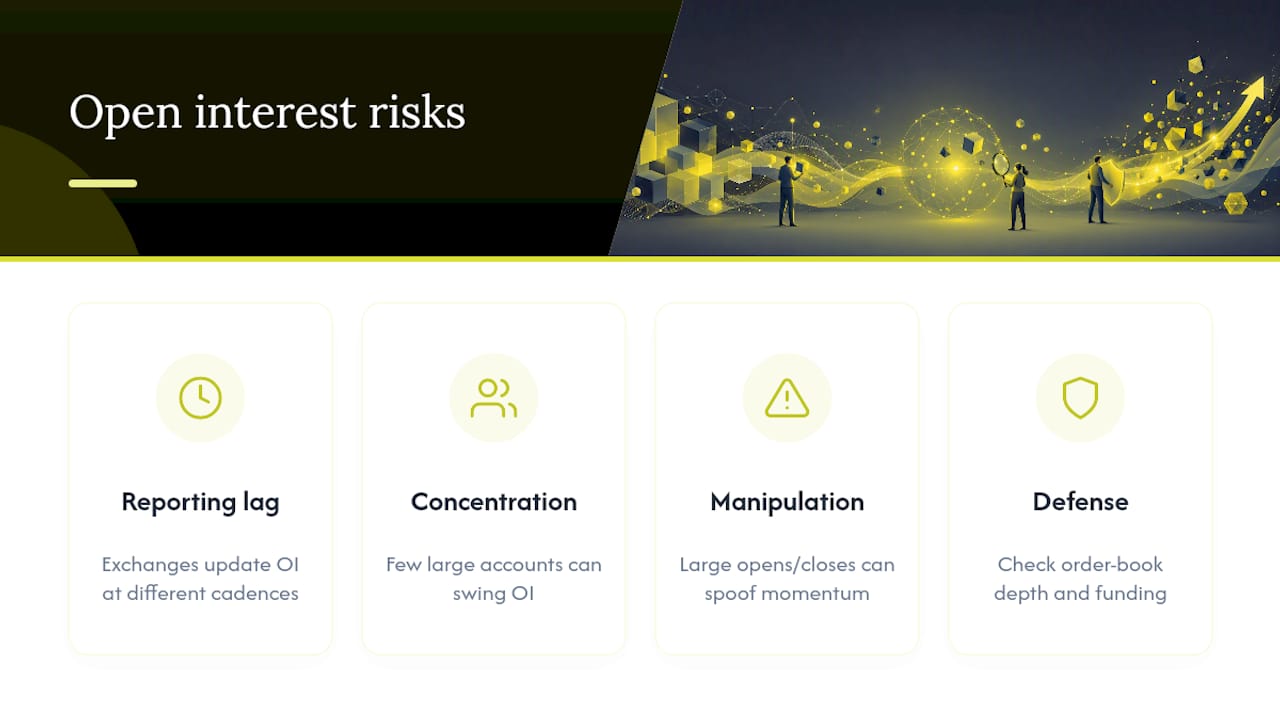
Open interest is a useful signal, not a complete one, and it has real blind spots that catch traders off guard. The most basic limitation is reporting lag: not every exchange refreshes its figures on the same cadence, so comparing a fast-updating venue against a slower one can make a market look more or less active than it actually is at that exact moment.
Concentration risk is the bigger issue. When a small number of large accounts hold a disproportionate share of a contract’s open interest, a single large liquidation or an intentional unwind can swing the number sharply without reflecting any broad shift in market sentiment. The CFTC’s Commitment of Traders framework exists partly to make this kind of concentration visible in regulated markets by separating reportable large-trader positions from the smaller nonreportable pool, but most crypto exchanges don’t publish an equivalent breakdown.
Manipulation is a real, if narrower, concern. Because open interest is public and closely watched, some traders will open and close large positions deliberately to create a misleading impression of momentum, sometimes called “spoofing” the derivatives book, before reversing hard once other traders have piled in on the false signal. This tends to show up most on lower-liquidity contracts and altcoin perpetuals rather than deep Bitcoin or Ether markets, where the capital required to move the number meaningfully is much higher. Cross-referencing open interest with order-book depth and funding rates remains the most practical defense against reading a manufactured spike as genuine conviction.
Real Trade Setups Where Open Interest Made the Difference
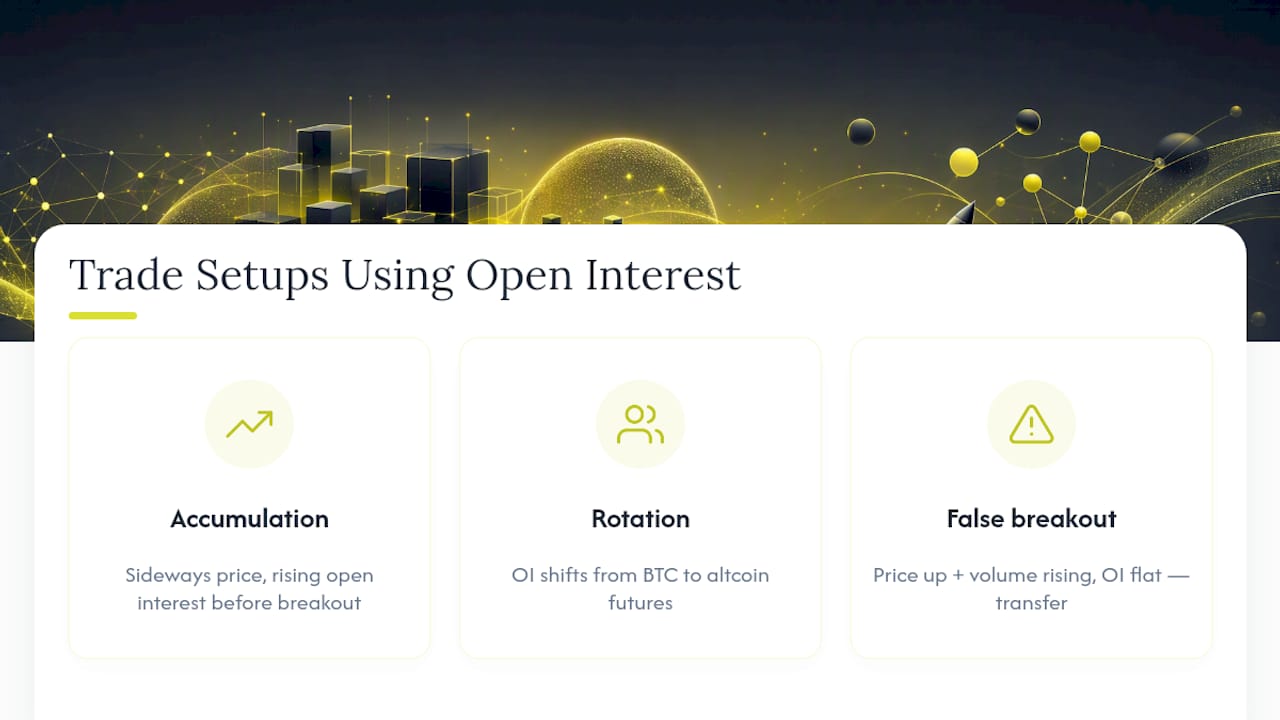
Consider a scenario that plays out regularly in Bitcoin futures: price grinds sideways for several days while open interest quietly climbs. Traders watching only price would see nothing worth acting on. Traders watching open interest alongside it would notice capital accumulating ahead of any breakout, exactly the kind of setup Techgaged flagged when Bitcoin derivatives activity went unusually quiet before a volatility spike. The eventual move, when it came, was sharper than the calm price action had suggested it would be.
A second common case involves altcoin rotations. When Bitcoin’s own derivatives indicators flash exhaustion, capital and open interest often begin shifting toward altcoin futures markets, a rotation pattern Techgaged covered in its piece on altcoin season signals tied to Bitcoin indicators. Traders who track open interest across both Bitcoin and major altcoin pairs get an early read on where fresh capital is heading before price fully confirms it.
A third example is the false breakout trap. Price pushes above a key resistance level on rising volume, but open interest barely budges. That combination, high volume without meaningful new position creation, often flags a transfer of existing contracts rather than a genuine breakout, and it’s a pattern worth checking against exchange deposit and withdrawal flows too, as Techgaged explored when Bitcoin exchange deposits hit an eight-year low. None of these setups are guaranteed outcomes. They’re examples of how open interest, read correctly against price and volume, gives traders a head start most headline-only readers miss.
For traders who want this kind of derivatives context delivered as it develops rather than after the fact, Techgaged’s ongoing crypto market coverage tracks open interest shifts, funding rate anomalies, and liquidation events across major Bitcoin and altcoin futures markets as they happen.
Sources
- Open Interest
- Open interest definition — Investopedia
- Total Bitcoin Open Interest — CoinGlass
- Explanatory notes — CFTC Commitment of Traders
FAQ
What Is Open Interest in Crypto?
Open interest is the total number of futures or options contracts on a cryptocurrency that remain open and unsettled at a given moment. It rises when new positions are created and falls when existing positions are closed, and it’s tracked separately from trading volume.
What Is the Current Open Interest on Bitcoin?
Bitcoin’s open interest changes constantly and varies by exchange and by whether it’s measured in contracts or USD notional, so no specific fixed figure applies globally. Aggregated dashboards like CoinGlass publish real-time totals broken down by exchange, and checking the timestamp on any figure you see is essential before acting on it.
Is Open Interest a Good Indicator?
Open interest is a genuinely useful indicator when paired with price and volume, particularly for confirming whether a trend has fresh capital behind it. It’s less reliable on its own, since concentration in a few large accounts or reporting lag between exchanges can distort the raw number.
How Is Open Interest Different from Trading Volume?
Volume counts every contract traded within a set period and resets each session, while open interest is a running total of contracts still outstanding regardless of how many times they’ve traded hands. High volume with flat open interest usually signals existing positions changing owners rather than new capital entering the market.
What Happens if Open Interest Falls While Price Rises?
That combination typically points to short sellers covering and closing positions rather than new buyers stepping in, a pattern often called a short squeeze. The rally can still be sharp, but it tends to run out of momentum once the covering is finished, unlike a rally backed by rising open interest.
Recommended
How do you rate this article?
Subscribe to our YouTube channel for crypto market insights and educational videos.






Join our Socials
Briefly, clearly and without noise – get the most important crypto news and market insights first.
Most Read Today
1
Protect Personal Savings: Hot and Cold Wallets, Watch Bluetooth Risks
2Chainlink Is Expanding Again — Here’s Where It’s Moving Next
3Ethereum Faces One of Its Most Extreme Sell-Side Readings on Binance
4Metaplanet Moves 3,000 BTC in 24 Hours — What Are They Planning?
5Solana’s Inflation Curve Gets a Major Overhaul After Community Vote
Latest





8
Also read
Similar stories you might like.
Crypto News
Solana’s Inflation Curve Gets a Major Overhaul After Community Vote
Azeez | 2026-08-29

Crypto News
Ethereum Faces One of Its Most Extreme Sell-Side Readings on Binance
Azeez | 2026-08-29

Crypto News
Chainlink Is Expanding Again — Here’s Where It’s Moving Next
Azeez | 2026-08-29

Crypto News
Metaplanet Moves 3,000 BTC in 24 Hours — What Are They Planning?
Azeez | 2026-08-29

Crypto Guides
Protect Personal Savings: Hot and Cold Wallets, Watch Bluetooth Risks
Rokas | 2026-08-29
Crypto News
Strategy’s Bitcoin Bet Now Comes With Far Less Leverage
Azeez | 2026-08-28

Crypto News
A Rare Ethereum Trend Is Emerging as Long-Term Holders Keep Taking Losses
Azeez | 2026-08-28

Crypto News
Base’s Tokenized Stock Market Gains Momentum as Trading Activity Surges
Azeez | 2026-08-28

Crypto News
Charles Schwab’s Latest Crypto Move Puts Solana, Avalanche, And Chainlink in Focus
Azeez | 2026-08-28

Crypto News
Smart Contract Wallets Explained: Features and Security
Rokas | 2026-08-28