











Blue Chainlink logo centered over a dark blue financial candlestick market chart. Source: TechGaged / Shutterstock.

New Chainlink wallets surged hard in late August, but the number worth watching isn’t the one grabbing headlines.
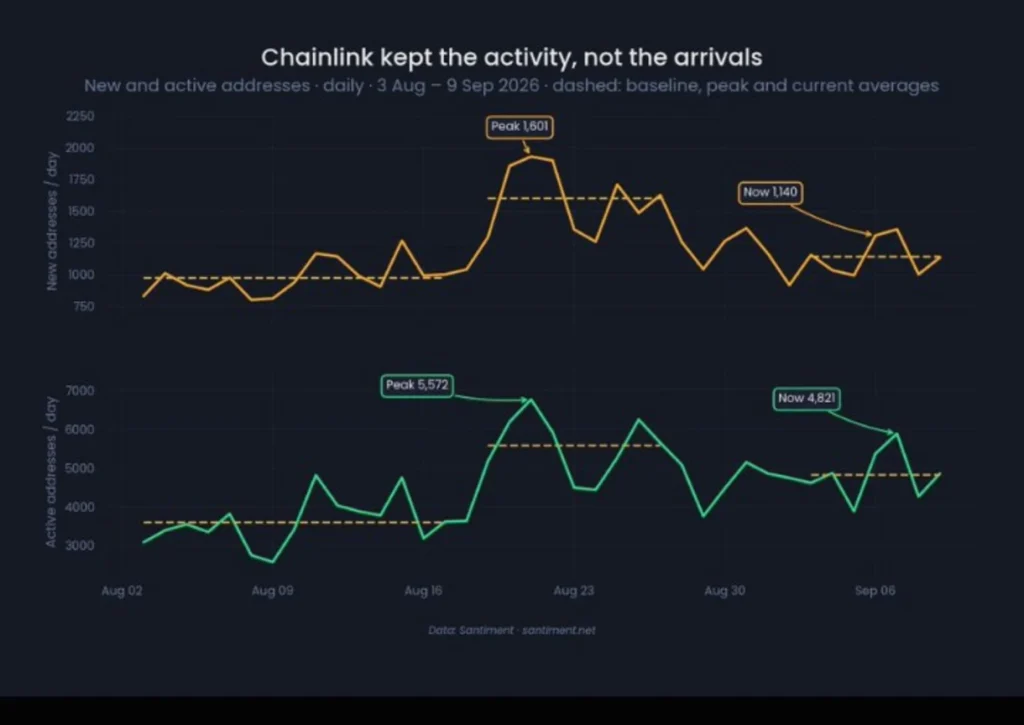
New address creation and active address counts both spiked sharply, then pulled back, according to Santiment’s on-chain data, and the shape of that pullback tells a more interesting story than the spike itself.
The Numbers Behind the Surge
New addresses averaged 974 a day in early August. That figure peaked at 1,601 around August 21, then settled back to 1,140 by early September. Roughly a quarter of that surge stuck around.
Latest Stories

Two Cities Control More Than Half of Solana’s Blocks — A Decentralization Question Emerges
One HYPE Whale Has Been Selling for 2 Weeks — What Could Be Behind It?

From Nearly Nothing to $4B: RWA Perps Are Reshaping Onchain Trading
Active addresses followed a similar arc, but held up better: a baseline of 3,599 climbed to a peak of 5,572, then eased to 4,821, retaining about two-thirds of the gain.
Why the Gap Between These Two Numbers Matters
New addresses measure fresh wallets showing up for the first time. Active addresses measure anyone transacting, new or returning.
The fact that active addresses held onto far more of their gain than new addresses did suggests the wallets that stuck around are the ones actually using the network, not just passing through.
A quarter of new arrivals stayed, but two-thirds of overall activity did.
This Isn’t Just Crypto’s Broader Momentum
The same window saw SOL active addresses climb 7.5% and ETH active addresses rise 5.2%.
Chainlink’s activity pattern doesn’t match either of those moves in shape or timing, which rules out a simple explanation where LINK just rode a market-wide wave. Something specific to Chainlink drove this.
Techgaged tracked the kind of infrastructure growth that could explain it, noting how tokenized real-world assets crossed $27 billion on-chain this year, activity that routes through oracle networks like Chainlink by necessity.
LINK’s Price Overview
LINK trades at $11.64 on September 10, 2026 (14:00 UTC), up 1.7% over seven days. The chart shows a sharp round trip.
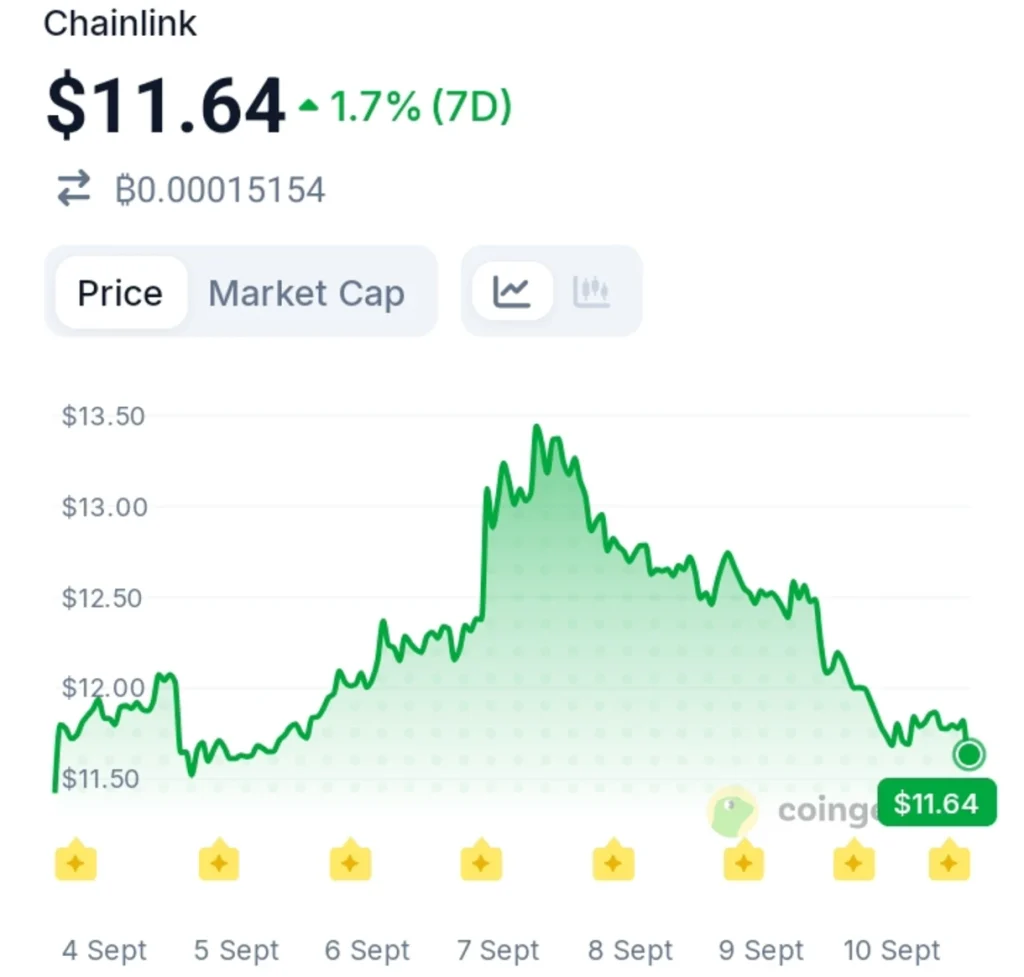
Price climbed steadily from $11.50 to peak near $13.60 by September 7 and 8, then dropped hard back to $11.64 by September 10, giving back nearly the entire run.
Techgaged also flagged the regulatory backdrop shaping this kind of on-chain demand, tracking the SEC’s ongoing work on tokenized equity rules, a category that leans on the same oracle infrastructure this address data is measuring.
What the Data Can’t Tell You
Address counts don’t reveal intent. There’s no way to know from this chart alone whether the same users are returning repeatedly, or whether a smaller group of addresses is simply transacting more often each day.
Both scenarios would produce an identical active-address chart. New wallets are cheap and easy to create. Sustained activity from those wallets is not, and that’s the harder signal to fake.
Disclaimer:
This article is for informational purposes only and does not constitute financial, investment, or trading advice. The views expressed are based on publicly available data, market observations, and the author’s interpretation at the time of writing. Cryptocurrency markets are highly volatile and unpredictable, and past performance or current technical setups do not guarantee future results. Readers should conduct their own research and consult with a qualified financial advisor before making any investment decisions. TechGaged does not accept liability for any losses incurred based on the information presented.
How do you rate this article?
Subscribe to our YouTube channel for crypto market insights and educational videos.






Join our Socials
Briefly, clearly and without noise – get the most important crypto news and market insights first.
Most Read Today
1
One HYPE Whale Has Been Selling for 2 Weeks — What Could Be Behind It?
2Clarity Act 2026: Everything You Should Know
3From Nearly Nothing to $4B: RWA Perps Are Reshaping Onchain Trading
4Crypto Oracles: 3 Roles Developers Must Secure to Prevent Exploits
5Two Cities Control More Than Half of Solana’s Blocks — A Decentralization Question Emerges
Latest





8
Also read
Similar stories you might like.

Crypto News
Bitcoin ETF Momentum Takes a Hit — The Next Sessions Could Matter
Azeez | 2026-09-09

Crypto News
Chainlink Hits $34T in Enabled Transactions — The Infrastructure Race Is Heating Up
Azeez | 2026-09-08

Crypto News
Abraxas Makes Another ETH Move — Its Massive Hyperliquid Short Holds the Key
Azeez | 2026-09-08
Crypto News
This Is the Only Crypto Sector Still Above Bitcoin’s Peak
Azeez | 2026-09-08

Crypto News
The Real World Assets (RWA) Race Has Taken a New Turn
Azeez | 2026-09-07

Crypto News
This AI Token Is Building Momentum as Attention Shifts Back to AI Sector
Azeez | 2026-09-07
Crypto News
Bitcoin Clears Its Biggest Leverage Test Since 2023
Azeez | 2026-09-07
Crypto News
Bitcoin ETF Demand Is Back — Now the Market Faces Its Next Test
Azeez | 2026-09-06
Crypto News
XRP Trading Volume Surges to a February High — Something Is Changing
Azeez | 2026-09-07
Crypto News
Solana Is Processing More Than the Rest — What Comes Next Could Be Bigger
Azeez | 2026-09-06