












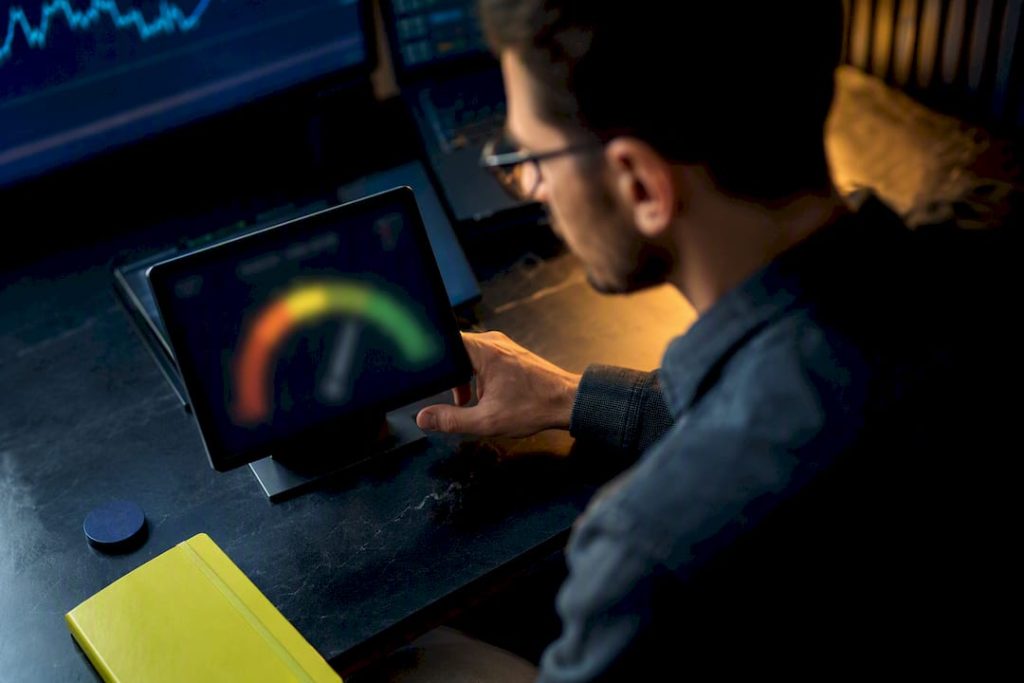
Analyst checking a crypto sentiment dashboard

The Crypto Fear and Greed Index is a daily 0-100 sentiment gauge that traders use as a fast contrarian filter. Extreme low readings tend to cluster near market bottoms, while extreme highs often show up when a rally is running hot. The score is a composite of several data inputs, not a single clean signal, so Techgaged treats it as a starting filter to confirm with price action and on-chain data, never as a standalone trade trigger.
TL;DR:
Latest StoriesRead all latest stories → Avalanche’s NYC Summit Hits Capacity — The Ecosystem Numbers Tell a Bigger Story
 Grayscale Files to Rename Litecoin Trust as an ETF: LTC’s Next Phase Begins
 Bitcoin’s Rally Has Reached a Decision Zone — The Next Break Could Be Huge
- Extreme fear readings below 25 often align with market bottoms, but signals are stronger when confirmed by on-chain profit, leverage, and news data.
- Extreme greed scores above 75 frequently precede corrections, especially if accompanied by high leverage and suspiciously euphoric social sentiment.
- Sharp index shifts tend to follow major news like regulatory actions or exchange failures, but these short-term reactions can be noise without on-chain confirmation.
- The index’s components include volatility, social sentiment, search interest, and Bitcoin dominance, with the latter acting as a counterbalance indicator.
- The daily update cycle and the index’s mixed lagging and leading signals require careful corroboration before making trading decisions.
Understanding the Crypto Fear and Greed Scale
The index runs from 0 to 100, and that number gets sorted into five labeled bands. Each band carries a different behavioral meaning for traders watching crypto market sentiment shift day to day.
- Extreme fear (0-24): Panic selling dominates. Prices often overshoot to the downside as weak hands exit, which is why contrarian traders start paying closer attention here.
- Fear (25-44): Caution is widespread. Buyers are hesitant but not fleeing, and volatility tends to compress compared to extreme fear readings.
- Neutral (45-54): No strong directional bias. The market is digesting recent moves rather than reacting to fresh emotion.
- Greed (55-74): Optimism builds and momentum traders pile in. Risk appetite is rising but hasn’t reached euphoric levels yet.
- Extreme greed (75-100): FOMO takes over. Buying often accelerates even as fundamentals lag, a pattern that has preceded several sharp corrections in past cycles.
These thresholds are conventions, not hard rules written into the index’s math. A reading of 23 isn’t meaningfully different from 26, so treat the bands as zones of interpretation rather than trip wires for automated decisions.
How the Fear and Greed Index Crypto Score Gets Calculated
The headline number is an average of several component scores, each normalized to its own 0-100 scale before being blended together. Typical methodologies weight the inputs roughly as follows, based on the framework TrendSpider documents:
- Volatility: Compares current price swings against 30 and 90 day averages. Rising volatility during a downtrend pushes the score toward fear.
- Market momentum and volume: Measures whether buying volume is accelerating or decelerating relative to recent trends.
- Social media sentiment: Tracks engagement volume and tone across platforms, looking for spikes in bullish or bearish chatter.
- Surveys and search interest: Some versions poll retail sentiment directly; others lean on Google Trends data for Bitcoin-related queries to catch rising public attention before it shows up in price.
- Bitcoin dominance: A rising dominance share can signal capital rotating into safety within crypto rather than exiting altogether.
- Trends: Broader search and web-traffic patterns tied to crypto-related terms.
The takeaway: no single input decides the score. A spike in search volume for “bitcoin crash” carries roughly the same statistical weight as a jump in realized volatility, which is why the composite can lag sudden, news-driven moves.
Not every implementation weights things the same way. Social and search-based versions, like the one described above, differ meaningfully from indices built around on-chain and leverage data, such as funding rates, open interest, or stablecoin flows. When a social-driven reading and an on-chain-led reading disagree sharply, that gap itself becomes a useful signal worth investigating.
Using the Index as a Contrarian Trading Filter
The classic rule of thumb: consider accumulation when the index drops near or below 25, and consider trimming exposure or taking profit when it climbs above 75. This isn’t a mechanical buy or sell trigger. It’s a prompt to look harder at what’s driving the number.
The psychology behind this approach is straightforward. Crypto markets run on emotional extremes, where FOMO drives buying into extreme greed and panic accelerates selling into extreme fear. The index exists to help traders recognize when they’re reacting to that emotion rather than to fundamentals.
Before acting on an extreme reading, run through this checklist:
- Check on-chain profit and loss metrics. Indicators like MVRV and SOPR reveal whether coin holders are sitting on losses or gains, which tells you whether panic or euphoria is backed by real capital positioning.
- Check funding rates and leverage. Extreme fear paired with high leverage often means more forced liquidations are coming, not a clean bottom.
- Review recent news and regulatory triggers. A fear spike tied to a specific headline behaves differently than fear building gradually over weeks.
- Adjust position sizing accordingly. Extreme readings call for smaller, staged entries or exits rather than all-at-once decisions.
Pro Tip: Watch for divergence between the social-driven index and on-chain metrics. If the index reads extreme fear but MVRV shows holders are still sitting on healthy profits, the panic may be narrative-driven rather than capital-driven, and that gap is worth a second look before you act.
What Historical Readings Show, and Where They Mislead
Single-digit readings have shown up near several notable cycle bottoms, and readings above 90 have appeared close to local tops, patterns that support the index’s reputation as a contrarian tool. These are empirical observations from past cycles, not a guarantee that the next extreme reading will resolve the same way.
The index’s biggest weakness is its mixed nature. Some components, like historical volatility and momentum, are lagging by design. Others, like search interest, behave more like leading proxies that can spike and fade quickly on headline noise. That blend can produce short-term contradictions where price momentum points one way while sentiment inputs point another.
A few other limitations worth flagging:
- Sustained extremes happen. A market can stay in extreme fear or extreme greed for weeks, so an early contrarian entry can face real drawdown before being proven right.
- Regime changes distort the baseline. A volatility spike during a genuine structural shift, like a major exchange collapse, means very differently than the same spike during a routine correction.
- Survey components sometimes go dark. When a survey input pauses or gets replaced, the composite shifts in ways that aren’t obvious from the headline number alone.
- Mid-range readings carry little signal. Between 45 and 54, the index is essentially saying “no strong emotion detected,” which offers almost nothing actionable.
How to Access Live Fear and Greed Index Data
Most trackers of this index offer a daily gauge showing the current score, a historical chart plotting past values, and an embeddable image for sites and dashboards. The score typically updates once per day, with a visible countdown to the next refresh rather than continuous real-time movement.
For anyone pulling this into a model or dashboard, the underlying API generally returns fields like value, value_classification, timestamp, and time_until_update for the latest entry. A few practical notes on using it well:
- Treat the daily value as a sentiment filter layered on top of your existing analysis, not a standalone signal.
- Avoid polling more frequently than the update cadence. The score doesn’t move intraday, so minute-level checks just waste API calls.
- Pull historical series when backtesting how sentiment extremes lined up with price action across past cycles, including moves like Bitcoin’s dominance swings against Ethereum.
How Techgaged Uses Sentiment Data in Its Coverage
Techgaged treats the index as a first-pass filter, not a headline generator. When a reading moves into an extreme band, that’s a prompt to pull price action, on-chain flows, and funding data before drawing any conclusion, not a signal to publish a call on its own.
Two triggers typically prompt deeper coverage: a sustained extreme lasting several days, and a meaningful divergence between the social-driven index and on-chain indicators like exchange deposit trends. A sample workflow looks like this: flag the extreme reading, cross-check MVRV and funding rates, scan for a specific news catalyst, then decide whether the story warrants a full analysis or just a data note. That sequence keeps sentiment readings grounded in what capital is actually doing, not just what people are saying online.

The Psychological Toll of Watching Sentiment Swing Daily
Checking a sentiment score every morning changes how people trade, and not always for the better. Traders who anchor too tightly to the daily number can end up chasing the index itself instead of the market it’s trying to describe, buying because the score says “fear” without asking why fear is showing up.
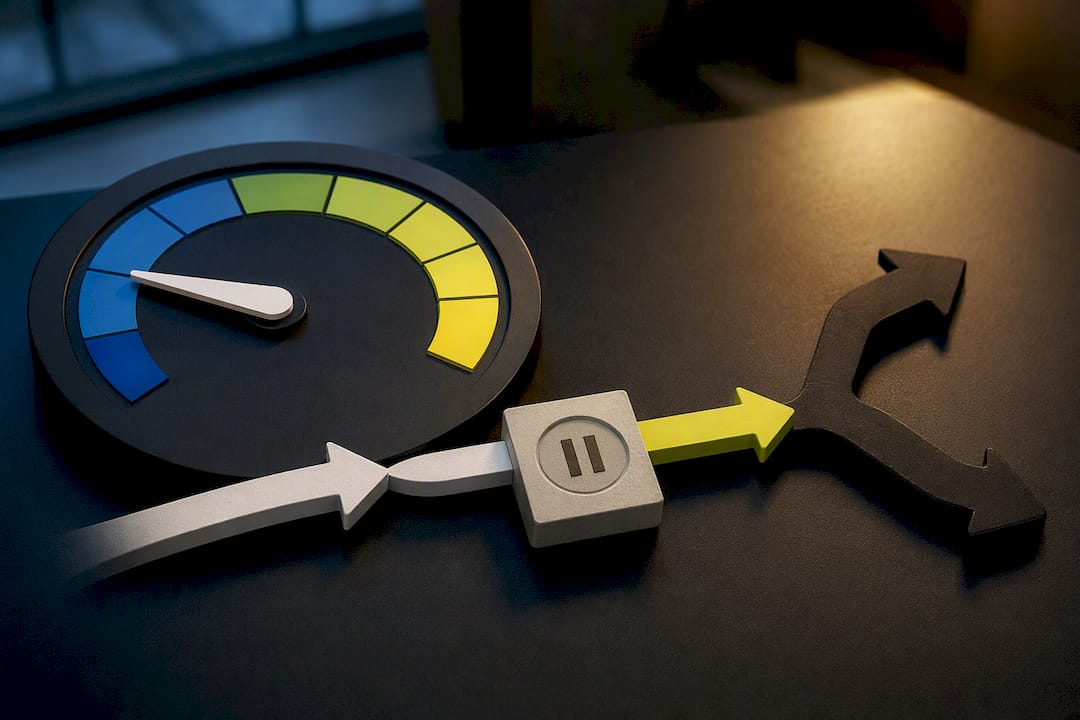
This is where crypto’s emotional intensity compounds the problem. Panic selling and euphoric buying feed on each other in fast, thinly regulated markets, and the psychological pull of FOMO and panic is stronger in crypto than in most traditional asset classes because price moves happen around the clock with no circuit breakers.
The index’s real value here is almost therapeutic: it gives traders a number to point to instead of a feeling. Seeing “extreme greed: 82” on screen can be enough to make someone pause before buying a top, simply because it externalizes an emotion they might not have named otherwise. The flip side is real too. Some traders develop a habit of fading every extreme reading mechanically, which turns a useful filter into a rigid rule that eventually gets run over by a genuine trend change. The healthiest use sits in the middle: let the score interrupt an emotional reaction long enough to check the data, then decide.
How This Index Compares to Wall Street’s Fear and Greed Gauge
Crypto’s sentiment index borrows its name and concept from a longer-running measure used in traditional equity markets, but the two aren’t built the same way. The stock market version leans heavily on options pricing, put-call ratios, and safe-haven demand, inputs that assume a market with market-makers, circuit breakers, and a regulated options layer underneath it.
Crypto doesn’t have that same infrastructure, so its version substitutes social media sentiment and search interest for options-based signals, alongside volatility and momentum measures adapted for a market that trades continuously. That substitution makes the crypto version more sensitive to viral narratives and less sensitive to the kind of institutional positioning that shows up in options flow.
The practical difference matters for anyone who has used the traditional index before. A stock market fear reading often reflects hedging activity by large institutions positioning defensively. A crypto fear reading is more likely to reflect retail traders and social chatter reacting to a price drop in real time. Neither is more “correct,” but they measure different things, and treating the crypto version as a direct equivalent misreads what’s actually driving the number. Both share the same core premise, that markets overreact in both directions, but crypto’s version is faster-moving, noisier, and more exposed to narrative spikes than its traditional counterpart.
Why Major News Events Move the Index So Sharply
Regulatory announcements, exchange collapses, and major protocol failures tend to move this index faster than almost any other input, because several of its components react to the same headline simultaneously. A single piece of news can spike search volume, shift social sentiment, and trigger volatility all at once, compounding what would otherwise be a modest one-component move into a large swing in the composite score.
Regulatory news is a particularly common trigger. A government tightening oversight of crypto transactions, as seen in recent regulatory action from China, can push the index toward fear within hours as traders search for details, social sentiment turns negative, and volatility ticks up in response to uncertainty. The same pattern plays out with exchange-specific news, where deposit and withdrawal data can shift quickly around a single event, as seen in patterns around multi-year lows in exchange deposits.
This is exactly why the index reacts faster to headlines than fundamentals often justify. Search and social components are, by nature, reactive to whatever story is dominating feeds that day, which means a rumor with no lasting impact can still produce a sharp, short-lived move in the score. Distinguishing a headline-driven spike from a structurally meaningful shift is the entire reason to corroborate with on-chain data before treating any single day’s reading as decisive.
Where to Verify the Methodology and Pull Live Data
For methodology details, TrendSpider’s documentation on crypto fear and greed data breaks down the component structure. For tracking public attention directly, running a live Google Trends query for “bitcoin” shows the same search-interest signal that feeds into the index itself. Treat the first as methodology reference and the second as a live data feed you can check anytime.
For ongoing coverage that ties sentiment readings to real market events, Techgaged’s crypto news coverage tracks how these swings line up with regulatory shifts, exchange flows, and price action as they happen.
Sources
FAQ
What Is a Good Crypto Fear and Greed Index Score?
There’s no single “good” score since the index works as a contrarian gauge. Readings below 25 (extreme fear) have historically aligned with buying opportunities, while readings above 75 (extreme greed) have often preceded corrections.
How Often Does the Index Update?
Most versions update once per day, with a visible countdown to the next refresh rather than continuous real-time changes throughout the day.
Can the Fear and Greed Index Predict Crypto Crashes?
Not reliably. It reflects current sentiment and has coincided with past tops and bottoms, but it’s a composite of lagging and reactive components, not a predictive model, and should be confirmed with on-chain and price data before acting.
Why Does the Index Sometimes Contradict Price Action?
The index blends lagging inputs like historical volatility with reactive inputs like social sentiment and search interest, which can spike on news before price fully reflects the same story, creating short-term disagreement between the score and the chart.
Is the Crypto Version the Same as the Stock Market Fear and Greed Index?
No. The stock market version relies on options pricing and safe-haven demand, while the crypto version substitutes social media sentiment, search interest, and volatility measures suited to a continuously trading, less regulated market.
Recommended
How do you rate this article?
Subscribe to our YouTube channel for crypto market insights and educational videos.






Join our Socials
Briefly, clearly and without noise – get the most important crypto news and market insights first.
Most Read Today
1
Bitcoin’s Rally Has Reached a Decision Zone — The Next Break Could Be Huge
2Clarity Act 2026: Everything You Should Know
3Ethereum’s Q3 Rally Just Hit a Major Milestone: Only One Year Was Stronger
4Avalanche’s NYC Summit Hits Capacity — The Ecosystem Numbers Tell a Bigger Story
5Grayscale Files to Rename Litecoin Trust as an ETF: LTC’s Next Phase Begins
Latest





8
Also read
Similar stories you might like.

Crypto News
Avalanche’s NYC Summit Hits Capacity — The Ecosystem Numbers Tell a Bigger Story
Azeez | 2026-09-13

Crypto News
Grayscale Files to Rename Litecoin Trust as an ETF: LTC’s Next Phase Begins
Azeez | 2026-09-13

Crypto News
Bitcoin’s Rally Has Reached a Decision Zone — The Next Break Could Be Huge
Azeez | 2026-09-13

Crypto News
Ethereum’s Q3 Rally Just Hit a Major Milestone: Only One Year Was Stronger
Azeez | 2026-09-13

Crypto News
SEC Chair Paul Atkins Joins Solana Summit — Crypto’s Next Regulatory Test Nears
Azeez | 2026-09-12
Crypto News
Goldman Sachs Changes Its Fed Call — The Next Rate Decision Could Shake Markets
Azeez | 2026-09-12

Crypto News
ETH Faces a New Test as Wintermute Sends Millions to Coinbase and Binance
Azeez | 2026-09-12

Crypto News
Morgan Stanley Adds Again as Its Bitcoin ETF Builds a $50M Accumulation Streak
Azeez | 2026-09-12

Crypto Guides
3 Blob Target: What EVM Developers Must Monitor in EIP-4844
Rokas | 2026-09-12

Crypto News
TRX Just Entered the U.S. ETF Market: The First-Day Signal Is Hard to Ignore
Azeez | 2026-09-11