














Bitcoin token with trading chart background. Source: TechGaged/Shutterstock.
Bitcoin’s Rally Has Reached a Decision Zone — The Next Break Could Be Huge

Bitcoin’s rally has hit a wall. The price sits between $76,000 and $82,000. It cannot break higher for now.
On-chain data shows why. A cluster of resistance sits just above the current price. A cluster of support sits well below it.
CryptoQuant Maps the Levels That Matter
CryptoQuant published its report on September 11, 2026. Analyst Julio Moreno said Bitcoin’s outlook remains bullish. But he said BTC must clear $81,700 first.
Latest Stories
Avalanche’s NYC Summit Hits Capacity — The Ecosystem Numbers Tell a Bigger Story

Grayscale Files to Rename Litecoin Trust as an ETF: LTC’s Next Phase Begins

Ethereum’s Q3 Rally Just Hit a Major Milestone: Only One Year Was Stronger
That level is Bitcoin’s 365-day moving average. Bulls have confirmed new bull markets at this level before.
CryptoQuant’s realized price bands chart shows two more hurdles above that. One sits at $83,600.
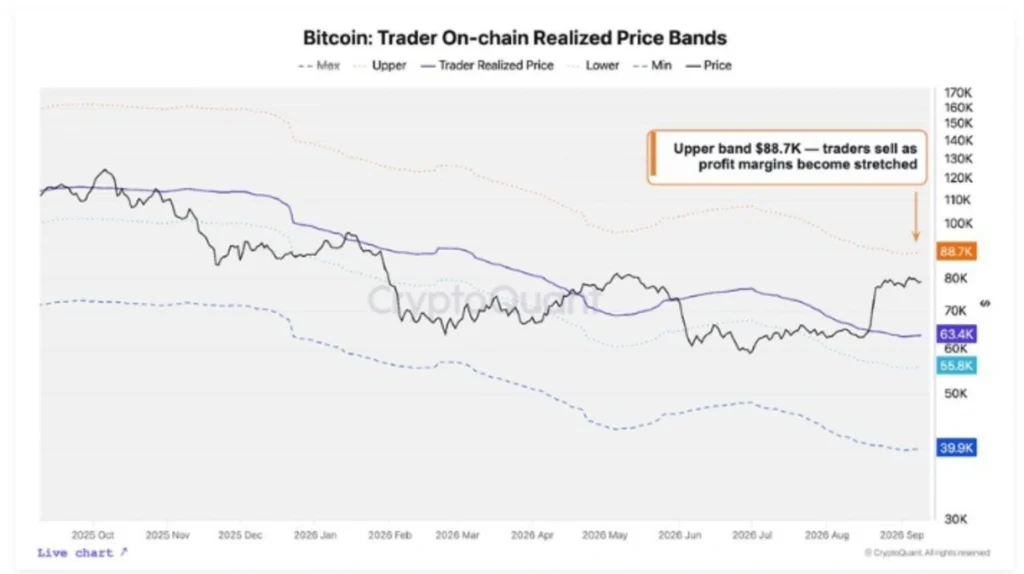
Another sits at $88,700, where trader profit margins get stretched. Below the current price, support sits at $70,000, Bitcoin’s 200-day moving average.
A deeper floor sits between $62,000 and $65,000. Long-term holders bought about 476,000 BTC in that zone this year.
ETF Flows Show a Mixed Picture
Institutional demand hasn’t confirmed the breakout yet. Farside Investors’ daily flow tracker shows spot Bitcoin ETFs losing money across several sessions this month.
Spot Ether ETFs have moved in the opposite direction on some days, pulling in fresh inflows even as Bitcoin funds bled out.
That split suggests capital is rotating between the two assets rather than leaving crypto altogether.
The Weekly Chart Shows a Fresh Flip
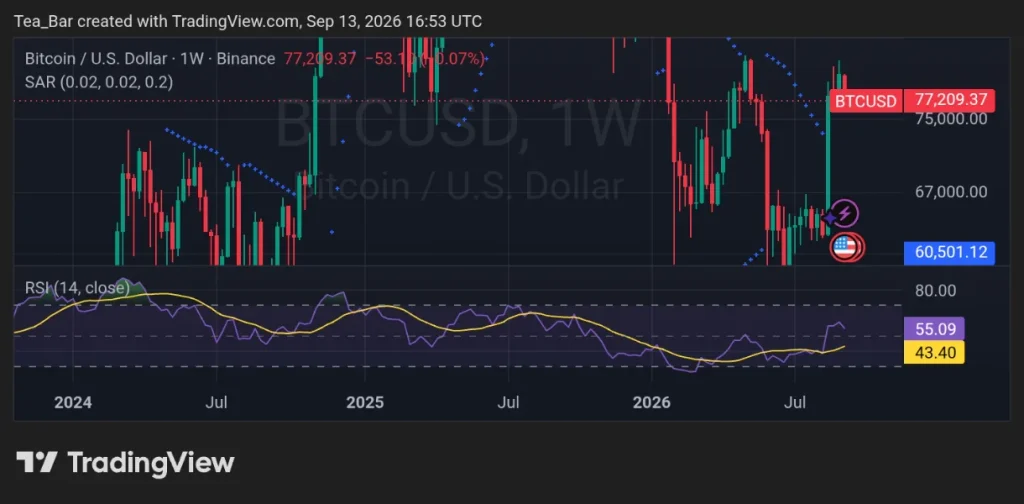
A TradingView chart created on September 13, 2026, at 16:53 UTC shows BTC/USD at $77,209.37.
That’s roughly flat on the week. The chart also shows a Parabolic SAR flip. The SAR dots moved below price.
That flip often signals fresh upward momentum on higher timeframes. RSI sits at 55.09. Its moving average sits lower, at 43.40. That gap suggests momentum is turning up after months of weakness.
Recovery Has Lifted the Rest of the Market
Bitcoin’s bounce has pulled other coins higher too. Bitcoin held near $78,000 in May while Hyperliquid and Zcash posted double-digit gains.
A similar pattern showed up the week before. Bitcoin’s recovery above $77,000 pushed Ethereum, Solana, and BNB back into the green.
Both moves followed sharp selloffs. Both moves show how closely altcoins track Bitcoin’s direction right now.
Why This Zone Matters So Much
The setup is simple. Supply sits overhead. Demand sits below. Neither side has won yet.
A close above $81,700 would confirm the bull case. A drop below $70,000 would open the door to deeper losses.
Given the SAR flip and rising RSI, Bitcoin looks more likely to test the upside resistance first before any deeper pullback plays out.
Disclaimer:
This article is for informational purposes only and does not constitute financial, investment, or trading advice. The views expressed are based on publicly available data, market observations, and the author’s interpretation at the time of writing. Cryptocurrency markets are highly volatile and unpredictable, and past performance or current technical setups do not guarantee future results. Readers should conduct their own research and consult with a qualified financial advisor before making any investment decisions. TechGaged does not accept liability for any losses incurred based on the information presented.
How do you rate this article?
Subscribe to our YouTube channel for crypto market insights and educational videos.






Join our Socials
Briefly, clearly and without noise – get the most important crypto news and market insights first.
Most Read Today
1
ETH Faces a New Test as Wintermute Sends Millions to Coinbase and Binance
2SEC Chair Paul Atkins Joins Solana Summit — Crypto’s Next Regulatory Test Nears
3Goldman Sachs Changes Its Fed Call — The Next Rate Decision Could Shake Markets
4Morgan Stanley Adds Again as Its Bitcoin ETF Builds a $50M Accumulation Streak
53 Blob Target: What EVM Developers Must Monitor in EIP-4844
Latest





8
Also read
Similar stories you might like.

Crypto News
Ethereum’s Q3 Rally Just Hit a Major Milestone: Only One Year Was Stronger
Azeez | 2026-09-13

Crypto News
SEC Chair Paul Atkins Joins Solana Summit — Crypto’s Next Regulatory Test Nears
Azeez | 2026-09-12

Crypto News
ETH Faces a New Test as Wintermute Sends Millions to Coinbase and Binance
Azeez | 2026-09-12

Crypto News
Morgan Stanley Adds Again as Its Bitcoin ETF Builds a $50M Accumulation Streak
Azeez | 2026-09-12

Crypto News
Bitwise Shuts Down Its DOGE ETF — What Went Wrong?
Azeez | 2026-09-11

Crypto News
Chainlink Keeps Building Its Strategic Reserve: The Bigger Move May Be Ahead
Azeez | 2026-09-11

Crypto News
Bitcoin Demand Is Starting to Stabilize — Is Stronger Accumulation Next?
Azeez | 2026-09-11

Crypto News
Solana Apps Just Outpaced the Next Network by 50% — A Bigger Trend Is Emerging
Azeez | 2026-09-10

Crypto News
Bitcoin Is Closing In on Institutional Break-Even — The Next Resistance Could Decide
Azeez | 2026-09-10

Crypto News
New Chainlink Wallets Are Surging — But One Metric Matters More Now
Azeez | 2026-09-10