













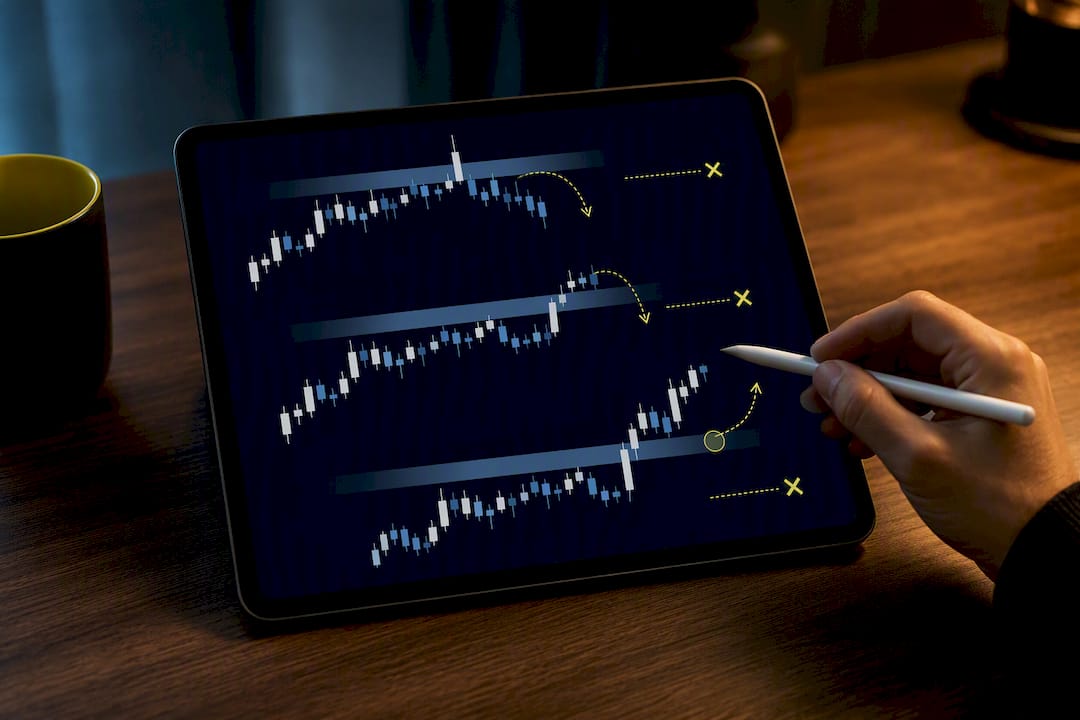
Analyst studying crypto candlestick patterns

Crypto chart patterns are recurring price structures, like head and shoulders, flags, or double bottoms, that reveal how buyers and sellers are fighting for control at a given price level. They fall into two groups worth learning first: reversals, which signal a trend running out of steam, and continuations, which signal a pause before the trend resumes. The single rule that separates a real signal from a trap: wait for a decisive close beyond the pattern’s boundary, backed by a volume spike, then confirmed by a retest of that level.
TL;DR:
Latest StoriesRead all latest stories → Bitcoin Positioning Just Hit a Major Reset — The Fed Could Trigger the Next Move
 Solana’s dApp Economy Is Back Near Its 2025 Peak — The Next Move Matters
 Ethereum Staking Hits an All-Time High: Liquid Supply Keeps Tightening
- Many crypto chart patterns, such as head and shoulders or double bottoms, have variable reliability depending on liquidity and timeframe; high-volume, large-cap assets on daily or 4-hour charts tend to produce more trustworthy signals.
- Confirming patterns requires a decisive close beyond the boundary, a volume spike, and a retest that holds, with failure often occurring from wick closes or low-volume breakouts.
- Pattern-based trades should be based on a thorough validation process, including checking for pattern completeness, proper size, and matching timeframe to the trading strategy, rather than chasing every shape.
- Using conservative position sizing based on the pattern’s measured move and placing stops just beyond the last swing low or high can prevent unnecessary losses from false signals.
- Automated scan tools can help identify valid patterns across multiple assets, but traders should always verify with manual confirmation to avoid relying on false or noisy signals.
What Crypto Chart Patterns Are and Why They Matter
Chart patterns are visual records of crowd psychology. Every triangle, flag, or double top is really just a snapshot of buyers and sellers repeatedly testing the same price zone until one side wins. That’s the useful way to think about crypto chart patterns: they’re repeatable structures that describe behavior, not deterministic forecasts of where price goes next.
That distinction matters because a pattern is a probability tool, not a promise. Even the most reliable formations fail some of the time, and no pattern works the same way across every token. Bitcoin and Ethereum tend to produce cleaner, more tradeable patterns on higher timeframes because deep liquidity keeps price action orderly; a low-cap altcoin with thin order books will throw false breakouts far more often, even when the chart looks textbook.
Patterns are worth trading in crypto when three conditions line up: the asset has real volume behind it, you’re reading a timeframe that matches your holding period, and the pattern itself is fully formed rather than something you’re forcing onto a messy chart. Skip any one of those and you’re gambling with extra steps.
Beginners tend to make the same handful of mistakes:
- Chasing a breakout candle after it’s already extended, instead of waiting for a retest.
- Ignoring volume entirely and trading the shape alone.
- Reading a pattern on the wrong timeframe for their strategy (a scalper trying to trade a weekly head and shoulders, for example).
- Forcing a pattern onto a chart that doesn’t actually have one, a habit sometimes called seeing “the pattern you want.”
- Treating every formation as tradeable, instead of keeping a short list of patterns they’ve actually practiced.
Traders who stick around tend to master a tight shortlist of five to eight patterns rather than memorizing dozens superficially. Depth beats breadth here.
Core Reversal Patterns Every Trader Should Master
Reversal patterns mark the point where a trend loses momentum and buyers or sellers switch control. Five formations cover most of what you’ll see on a crypto chart.
- Head and shoulders. Three peaks form, with the middle one higher than the two flanking it. The trigger is a close below the “neckline,” the line connecting the two low points between the peaks. Your price target is the distance from the head’s peak to the neckline, projected downward from the breakout point. A stop goes just above the neckline or the right shoulder, whichever gives you a tighter, more defensible exit.
- Inverse head and shoulders. The mirror image, signaling a bottom. Same neckline logic, same measured-move math, just flipped: target is the head-to-neckline distance projected up from the breakout.
- Double and triple tops/bottoms. Price tests the same high (or low) two or three times and fails to break through. The textbook entry isn’t the first touch of the neckline. It’s the close beyond it, followed by a retest that gets rejected in your favor. Target equals the height from the tops/bottoms to the neckline, projected from the break.
- Rounding bottoms (saucers). These form slowly, often over weeks, as selling pressure fades gradually rather than snapping. Because they take longer to build, a confirmed rounding bottom on a daily or weekly chart tends to carry more conviction than a sharp V-shaped reversal. They’re rarer in fast-moving crypto pairs but show up more often on established large-cap assets.
- Triple tops/bottoms behave like their double counterparts but with an extra test of the level, which some traders read as added confirmation, though it also means a longer wait for the setup to complete.
Reversal patterns tend to show their clearest signals on the 4-hour and daily charts, where noise from bot-driven scalping gets filtered out. On a 15-minute chart, a head and shoulders can look convincing and still fail within the hour.
Pro Tip: Draw your neckline as a zone, not a single line. Crypto wicks are messy, and treating the neckline as a range of a few ticks wide will save you from getting stopped out by noise on an otherwise valid setup.
Historical completion-rate data compiled from stock market studies and adapted for crypto by pattern researchers shows double bottoms and triple bottoms rank among the more reliable reversal setups by historical break-even rate, though even the strongest patterns fail a meaningful share of the time. Treat that as a reason to size conservatively, not a green light to skip your stop.
Core Continuation Patterns Every Trader Should Master
Continuation patterns are pauses, not reversals. They tell you the dominant trend is catching its breath before pushing further in the same direction.
- Bull and bear flags. A sharp move (the “pole”) is followed by a tight, slightly angled consolidation (the “flag”). Volume should fall during the flag and spike again on the breakout. Your target is the height of the pole, projected from the point where price breaks out of the flag.
- Pennants. Structurally similar to flags, but the consolidation narrows into a small symmetrical triangle instead of a parallel channel. Same volume signature, same measured-move math using the pole’s height.
- Ascending triangles. A flat resistance line meets a rising support line. These favor a bullish breakout because buyers keep stepping in at higher lows, absorbing supply at the same ceiling.
- Descending triangles. The bearish mirror: a flat support line meets falling resistance, favoring a breakdown.
- Symmetrical triangles. Both boundaries converge toward each other. These are directionally neutral until the breakout candle tells you which way the crowd voted.
- Cup and handle. A longer, rounded dip (the cup) followed by a small pullback (the handle) before continuation. Because this pattern takes longer to form, often across daily or weekly candles, a confirmed cup and handle tends to be a higher-quality signal than a fast intraday flag. Cup and handle patterns rank among the stronger performers in historical pattern statistics as well.
- Rising and falling wedges, and channels. Inside a channel, you can trade the bounce off either boundary as long as the channel holds. A wedge is different: it’s a compression pattern that usually resolves against the direction it’s leaning, so a rising wedge in an uptrend often breaks down rather than up.
The practical rule across all of these: the pole or prior trend leg sets your target size, and the consolidation itself sets your entry trigger. Miss the volume drop during consolidation and you’re probably looking at a random sideways chop, not a real continuation setup.
Confirmation, Timeframes, and How Patterns Fail
Every pattern above lives or dies on the same three-step confirmation check: a decisive close beyond the boundary, a volume spike accompanying that close, and a retest of the broken level that gets rejected in your favor. Skipping any one of these three steps is where most losing pattern trades come from.
- Step 1, decisive close: a wick poking through the boundary doesn’t count. Wait for the candle to close beyond it on your chosen timeframe.
- Step 2, volume expansion: the breakout candle’s volume should meaningfully exceed the recent average. A breakout on flat or falling volume is a warning sign, not a signal.
- Step 3, retest: price often returns to the broken level before continuing. If it holds (support becomes support, resistance becomes resistance), that’s your highest-conviction entry. Practitioner cheat-sheets consistently flag the retest as the single most effective filter for cutting down false breakouts.
Timeframe changes how much you should trust a pattern. Here’s a rough reliability guide for crypto specifically:
| Timeframe | Best for | Reliability notes |
|---|---|---|
| 5 minute | Scalping | High noise, frequent fakeouts; only trade with tight stops and strict volume filters |
| 15 minute | Intraday | Moderate reliability; needs confirmation from a higher timeframe trend |
| 1 hour | Intraday/swing | Cleaner structure; a common sweet spot for day traders |
| 4 hour | Swing | One of the most useful timeframes for pattern scanning in crypto specifically |
| Daily | Position | Slowest to form, but historically the most reliable signals |
A pattern’s historical break-even rate is never a guarantee. Even top-ranked formations like cup and handle and double bottoms fail a real share of the time, so confirmation and a stop loss are crucial, which is exactly why the confirmation checklist and a hard stop matter more than picking the “best” pattern.
The two most common failure modes are wick closes (price pierces the boundary but closes back inside it) and low-volume breakouts (a move happens on thin participation and reverses fast). When you see either, the rule is simple: don’t chase it. Wait for a genuine retest, or reduce your position size if you decide to enter anyway. Your stop should sit just beyond the structure itself, below the last swing low for a bullish setup or above the last swing high for a bearish one, never at an arbitrary percentage that ignores the chart.
How to Trade Crypto Chart Patterns Step by Step
Here’s a workflow you can run on any liquid pair, from Bitcoin down to a mid-cap altcoin with real volume behind it.
- Scan. Filter for assets with adequate daily volume and market cap, since thin order books produce unreliable patterns. Pick a timeframe that matches your holding period, and only look at patterns that are fully formed, with clear, touchable boundaries.
- Validate. Run the three-step check: decisive close, volume expansion, and ideally a retest. If a setup only satisfies one of the three, treat it as a watch item, not a trade.
- Size. Calculate your position based on the distance between your entry and your stop, not a fixed dollar amount. A wider pattern (say, a head and shoulders spanning several dollars of price) demands a smaller position than a tight flag, if you’re keeping your dollar risk constant per trade.
- Enter. You’ve got two real choices: enter on the breakout close for speed, accepting worse average price and higher fakeout risk, or wait for the retest for a tighter stop and better odds, accepting that some setups simply never retest and you miss the move.
- Manage. Move your stop to breakeven once the trade covers a meaningful portion of its target. Scale out partial profits at logical levels rather than waiting for the exact measured-move target.
- Exit. Take the rest of the position off at your calculated target, or trail it if momentum clearly continues past that level.
Worked example: Say a mid-cap token forms a bull flag after a sharp rally, pole height of $2.00, flag consolidating in a tight range with volume fading during the pause. Price closes above the flag’s upper boundary on rising volume, then pulls back to retest that boundary and holds. Entry: on the retest hold, near the broken flag line. Stop: just below the flag’s lowest point, invalidating the setup. Target: pole height ($2.00) projected up from the breakout point.
Pro Tip: Write your entry, stop, and target down before you place the trade, not after. If you can’t state all three in one sentence, the setup isn’t ready yet.
Tools, Screeners, and Chart Setups for Pattern Trading
Charting platforms like TradingView give you manual control for drawing and confirming patterns by eye, which is still the most reliable way to learn the shapes. Automated pattern scanners, by contrast, save time by surfacing candidates across dozens of pairs at once, though they need conservative filters to stay useful. Live scanner tools that list active patterns across symbols and timeframes work best when you pair them with your own confirmation check rather than trading their alerts blind.
Useful screener filters to set:
- Minimum 24 hour volume, to filter out illiquid tokens prone to fakeouts.
- Minimum market cap, for the same reason.
- Timeframe alignment matching your trading style (don’t scan 5 minute patterns if you swing trade).
- Pattern family filter (reversal vs. continuation), so alerts match the bias you’re already leaning toward from broader market context, including derivatives positioning and broader liquidity conditions.
That combination alone catches most of the setups worth acting on.
Author Methodology and Editorial Standards
This guide was written by Justinas, a contributor at Techgaged focused on market patterns and price-move analysis. Every example here uses liquid, high-volume pairs, never a cherry-picked outlier chosen because it happened to work perfectly.
The editorial standard for trading content here is evidence first: claims are grounded in documented pattern behavior and confirmation rules, backed by confluence rather than shape alone, and risk guidance stays conservative rather than promotional. Nothing here should be read as a guarantee. Chart patterns are probabilistic signals, and even the most reliable ones fail a meaningful share of the time. Position sizing and stop discipline matter more than any single setup. For ongoing market context that feeds into pattern decisions, Techgaged’s crypto news coverage tracks the liquidity and macro shifts that make some patterns more trustworthy than others in a given week.
If you want to build pattern recognition around a real, current example, coverage of Bitcoin’s move above $109,000 walks through how a high-liquidity breakout can still stall without volume support, a useful case study for the exact confirmation checklist covered above.
Sources
This article is general information, not a substitute for advice from a qualified financial advisor. Consult a qualified financial professional about your own circumstances before acting on anything here.
FAQ
Do Chart Patterns Actually Work in Crypto?
Yes, in the sense that they describe repeatable crowd behavior and can improve your odds when confirmed properly, but no pattern works every time. Historical completion rates for even top patterns like double bottoms and cup and handles fall well short of certainty, so a confirmation checklist and a stop loss matter as much as the pattern itself.
What Is the Best Chart Pattern for Crypto?
There’s no single best pattern, but cup and handle, double bottoms, and ascending triangles rank among the more reliable formations based on historical pattern statistics. Reliability still depends heavily on the asset’s liquidity and the timeframe you’re trading.
Which Chart Type Is Best for Spotting Crypto Patterns?
A standard candlestick chart is the most widely used format for pattern recognition, since it shows open, high, low, and close in a way that makes wicks and rejections easy to read. Line charts smooth out too much detail to reliably confirm boundary closes.
Can You Make $100 a Day Trading Crypto Patterns?
It’s possible on paper with the right account size and consistent execution, but it isn’t a realistic baseline expectation for a beginner. Pattern trading is probabilistic, not guaranteed, and even well-confirmed setups fail often enough that risk management, not daily profit targets, should drive your position sizing.
Recommended
- Altcoin season soon to start if this Bitcoin indicator follows previous patterns, analyst claims
- Post crash: Altcoins set to pump hard if 2020 repeats itself
- Bitcoin’s next leg up may be closer than you think, according to these key indicators
- Something Is Changing On Chainlink: Whales Send A Major Signal
How do you rate this article?
Subscribe to our YouTube channel for crypto market insights and educational videos.






Join our Socials
Briefly, clearly and without noise – get the most important crypto news and market insights first.
Most Read Today
1
Clarity Act 2026: Everything You Should Know
2Bitcoin Positioning Just Hit a Major Reset — The Fed Could Trigger the Next Move
3Ali Martinez Spots an XRP Breakout Setup as Investors Watch
4At 25 or 75: Trader On Chain Checks for Crypto Fear and Greed Index
5Ethereum Staking Hits an All-Time High: Liquid Supply Keeps Tightening
Latest





8
Also read
Similar stories you might like.

Crypto News
Bitcoin Positioning Just Hit a Major Reset — The Fed Could Trigger the Next Move
Azeez | 2026-09-14

Crypto News
Solana’s dApp Economy Is Back Near Its 2025 Peak — The Next Move Matters
Azeez | 2026-09-14

Crypto News
Ethereum Staking Hits an All-Time High: Liquid Supply Keeps Tightening
Azeez | 2026-09-14
Crypto News
Ali Martinez Spots an XRP Breakout Setup as Investors Watch
Azeez | 2026-09-14

Crypto Guides
At 25 or 75: Trader On Chain Checks for Crypto Fear and Greed Index
Rokas | 2026-09-14
Crypto News
Avalanche’s NYC Summit Hits Capacity — The Ecosystem Numbers Tell a Bigger Story
Azeez | 2026-09-13

Crypto News
Grayscale Files to Rename Litecoin Trust as an ETF: LTC’s Next Phase Begins
Azeez | 2026-09-13

Crypto News
Bitcoin’s Rally Has Reached a Decision Zone — The Next Break Could Be Huge
Azeez | 2026-09-13

Crypto News
Ethereum’s Q3 Rally Just Hit a Major Milestone: Only One Year Was Stronger
Azeez | 2026-09-13

Crypto News
SEC Chair Paul Atkins Joins Solana Summit — Crypto’s Next Regulatory Test Nears
Azeez | 2026-09-12