











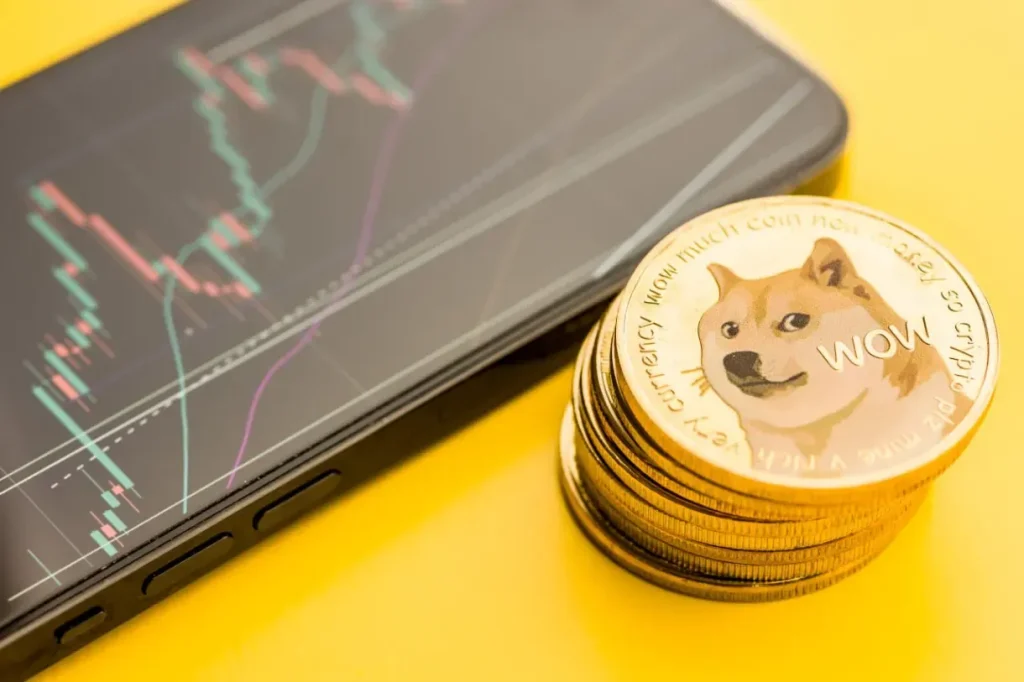
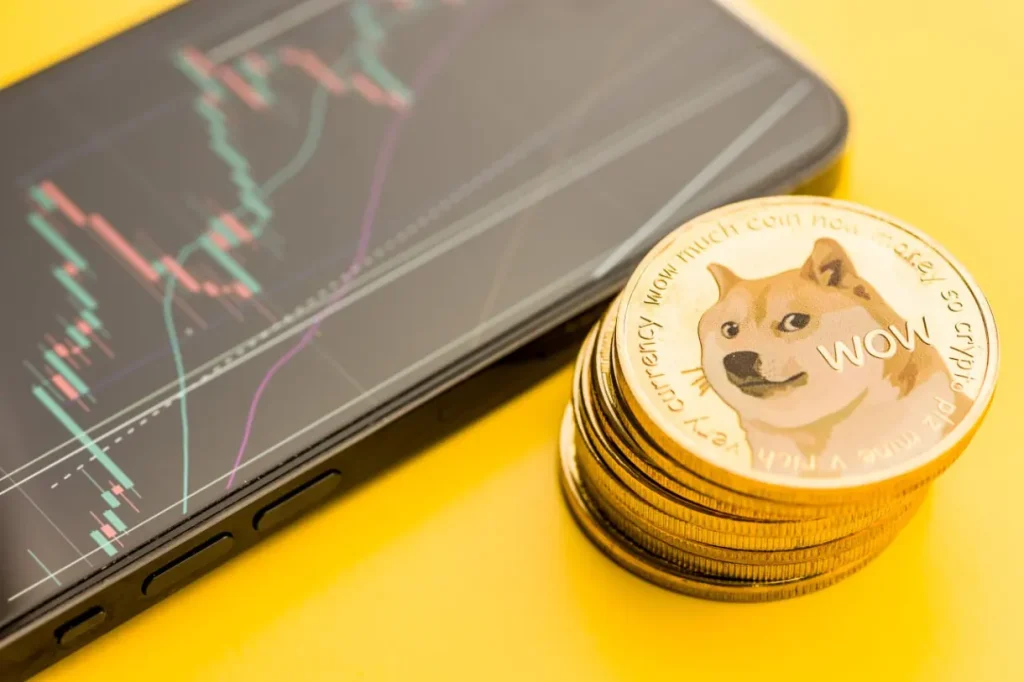
Dogecoin with price chart on a mobile device. Source: TechGaged / Shutterstock.
DOGE Faces a 28 Billion Coin Resistance Wall as Top Analyst Predicts the Next Leg

Dogecoin is running into a wall built from real trading history. Roughly 28 billion DOGE changed hands around $0.098. That makes it one of the biggest resistance zones on the chart right now.
The Resistance Levels Mapped Out
Analyst Ali Martinez shared the Cost Basis Distribution Heatmap on his X account.
The chart tracks how much DOGE last traded at each price level, using data sourced from Glassnode.
Latest Stories

Sui Is Preparing Something Big — Basecamp 2026 Could Reveal It All

XRP Is Moving Beyond Crypto-Only Products as Traditional ETF Exposure Expands

ADA ETF Decision Nears — One SEC Date Could Trigger a Market Shakeup
The $0.098 zone stands out as the nearest major barrier. Clear that, and the next wall sits near $0.11, backed by roughly 4.98 billion DOGE.
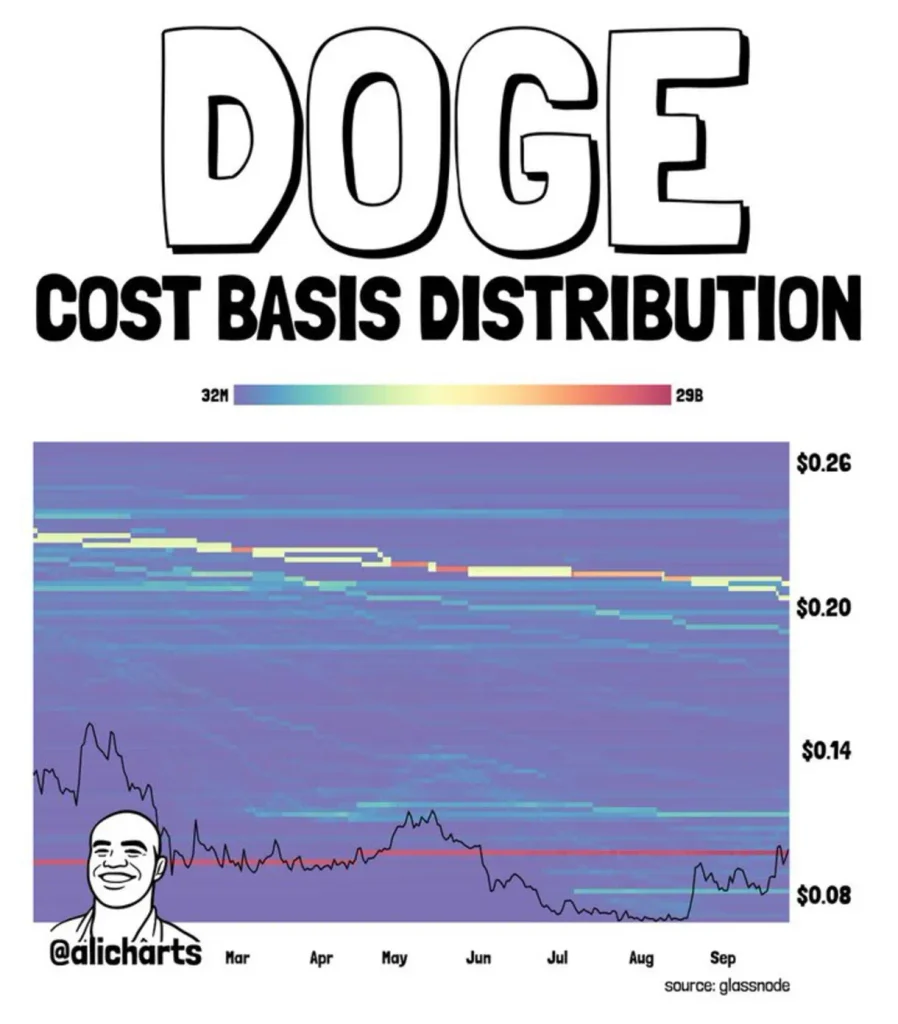
Beyond that, $0.20 becomes the next major hurdle, supported by about 12 billion DOGE.
Each level represents real coins that changed hands there, not just a technical drawing on a chart.
Whale Buying Has Shown Up Before Key Moves
Resistance zones matter more when large holders are actively positioning around them.
Dogecoin whale balances climbed from roughly 34.97 billion to 35.94 billion DOGE over several days earlier this year, a pattern that has sometimes preceded periods of increased volatility.
Accumulation alone doesn’t guarantee a breakout, but it tends to draw attention right as price approaches levels like this one.
A Familiar Setup From Earlier This Year
DOGE has flashed similar technical signals before. The token tagged the lower boundary of its rising channel earlier this year, a pattern that had preceded strong upside moves in prior instances of this cycle.
Traders read that structure as a possible reload point rather than a breakdown.
The current setup near $0.098 carries some of that same tension between resistance overhead and support building underneath.
Weekly Chart Shows Momentum Building
A TradingView weekly chart created on September 27, 2026, at 09:42 UTC shows DOGE/USD at $0.09773, up 1.03% on the week.
MACD reads 0.00427, turning positive after a stretch of red bars through the summer.
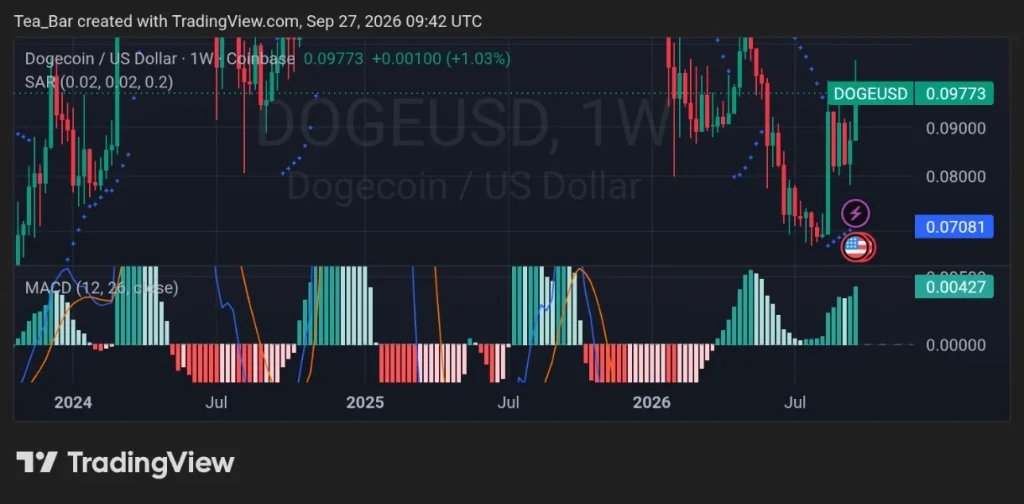
The chart shows a sharp bounce off the $0.07081 zone in recent weeks, with price steadily climbing back toward the $0.098 resistance level described in Martinez’s heatmap.
Breakdowns Can Set Up Bigger Moves Too
Resistance walls don’t always hold. A breakdown below key support once opened the door to a speculative $2 target for some traders, even as confirmation remained far from certain.
That history shows both directions carry real weight once DOGE tests a heavily traded price zone like this one.
The Test That Decides the Next Move
With 28 billion coins sitting right at the current price, this level is about to get a real test.
A clean break above $0.098 opens the path toward $0.11 and eventually $0.20. Failing here would likely send DOGE back to retest support built up over the past few weeks.
Disclaimer:
This article is for informational purposes only and does not constitute financial, investment, or trading advice. The views expressed are based on publicly available data, market observations, and the author’s interpretation at the time of writing. Cryptocurrency markets are highly volatile and unpredictable, and past performance or current technical setups do not guarantee future results. Readers should conduct their own research and consult with a qualified financial advisor before making any investment decisions. TechGaged does not accept liability for any losses incurred based on the information presented.
How do you rate this article?
Subscribe to our YouTube channel for crypto market insights and educational videos.






Join our Socials
Briefly, clearly and without noise – get the most important crypto news and market insights first.
Most Read Today
1
ADA ETF Decision Nears — One SEC Date Could Trigger a Market Shakeup
2HBAR Goes After the $5T Tokenization Narrative With Major Stocks
3Altcoin Season Indicators Jump as Bitcoin Dominance Stalls: What Changed?
4Chainlink Reserve Crosses 6 Million LINK — What This Means for the Token
5Bitcoin’s Demand Is Holding Strong — One On-Chain Level Could Decide What Comes Next
Latest





8
Also read
Similar stories you might like.

Crypto News
Bitwise Shuts Down Its DOGE ETF — What Went Wrong?
Azeez | 2026-09-11

Crypto News
Top Crypto Analyst Signals Dogecoin Could Be Ready For A Parabolic Rally
Azeez | 2026-08-16
Altcoins
Whale Watch: Smart Money Is Silently Accumulating These Altcoins
Azeez | 2026-05-02

Altcoins
Dogecoin Awakens After Seventy-Three Days as SpaceX Eyes June IPO
Azeez | 2026-05-01

Altcoins
Dogecoin’s Path to $0.50 in 2026: What Would Actually Need to Happen
Azeez | 2026-04-26

Altcoins
Safe or Suspect? What Wealthsimple’s Partnership with X Means for DOGE
Azeez | 2026-04-19
Altcoins
Dogecoin Goes Live on Rakuten: Can 44 Million Japanese Users Influence DOGE?
Azeez | 2026-04-17

Altcoins
Could SpaceX’s IPO Be the Catalyst That Sends Dogecoin Above $0.10?
Azeez | 2026-03-29
Altcoins
Is Dogecoin About to Move? X Payments Narrative Gains Momentum
Azeez | 2026-03-20