












A Dogecoin token sits within clouds. Source: TechGaged / Shutterstock.

Dogecoin has spent months grinding lower, but one well-followed chart analyst thinks the setup is about to flip.
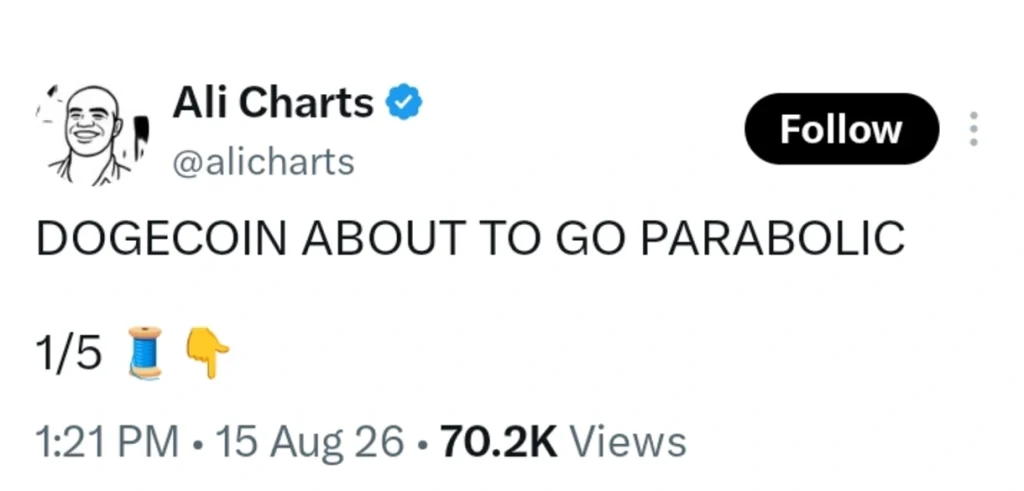
Ali Charts posted a five-part breakdown on August 15 laying out why the meme coin might be closer to a major move than the price action suggests.
The Signal Driving The Call
Ali pointed to the Tom DeMark Sequential indicator, which flashed a buy signal on Dogecoin’s monthly chart last month.
Latest Stories

Goldman Sachs XRP ETF Claim Resurfaces — But The Numbers Look Familiar
Crypto Markets Get A Major Regulatory Boost Even Without CLARITY Act Passage

Cardano Is Still 94% Below Its Peak — What Went Wrong With ADA?
That signal has a track record worth noting: TD Sequential buy signals correctly flagged DOGE’s early-May correction, when price slipped from $0.113 down to $0.078.
A monthly buy signal carries more weight than a daily one, since it takes far longer to form and tends to mark bigger turning points.
Where The Real Resistance Sits
The key level to watch, according to Ali, is around $0.0813, where more than 30 billion DOGE previously changed hands.
A sustained close above that zone would confirm the breakout thesis, opening a path toward the next resistance near $0.177.
Techgaged has flagged similar resistance-and-breakout setups on DOGE before, including a cup-and-handle formation near the $0.11 level earlier this year that also hinged on a confirmed close above a specific price shelf.
A Pattern That Has Repeated Before
Ali also drew a direct comparison to August 2022, when Dogecoin formed an inverted hammer candle alongside a TD buy signal, followed by a doji.That combination has shown up at prior turning points too.
Techgaged covered a related setup in February, when Dogecoin revisited a major historical support level that mirrored breakdowns seen in 2016 and 2019 to 2020, both of which preceded strong bull runs.
If history is any guide, DOGE’s price behavior near key structural levels has mattered more than the news cycle surrounding it.
What’s Backing This Up Beneath The Surface
Network activity has also been improving. Active DOGE addresses climbed from 38,000 in July to 44,000 by mid-August, according to on-chain data shared alongside Ali’s thread, and whale wallets have been accumulating alongside the technical setup.
Rising participation paired with a bullish chart signal tends to carry more weight than either one alone.
The Chart As It Stands
As of 14:57 UTC on August 16, 2026, DOGE/USD trades at $0.06996 on the weekly chart, up 0.62%.
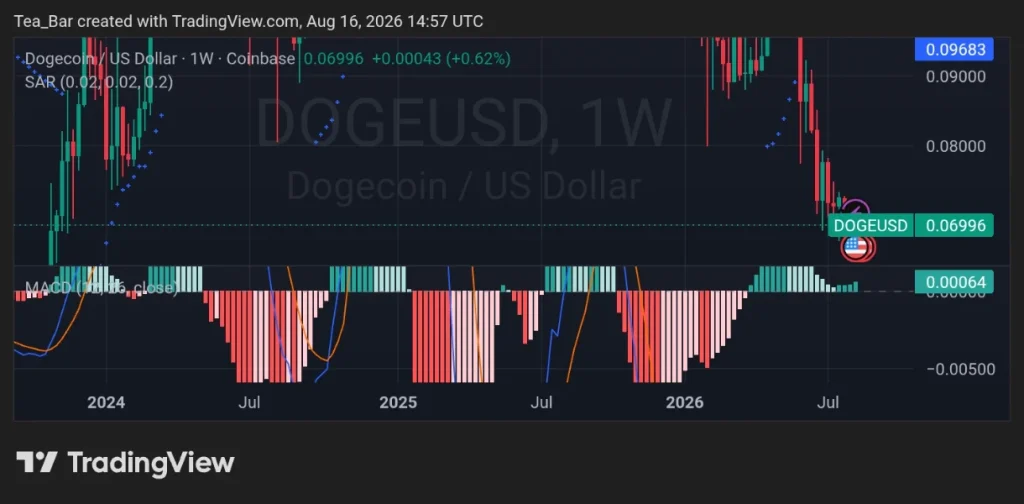
Price has pulled back sharply from highs above $0.09 in July, though the weekly MACD histogram has just turned positive again after months of deep red bars, a shift that has lined up with past recovery phases on this same chart.
Whether this turns into the kind of parabolic move DOGE has produced twice before, or whether the $0.0813 resistance holds firm and stalls the whole thesis, is what traders will be watching next.
Disclaimer:
This article is for informational purposes only and does not constitute financial, investment, or trading advice. The views expressed are based on publicly available data, market observations, and the author’s interpretation at the time of writing. Cryptocurrency markets are highly volatile and unpredictable, and past performance or current technical setups do not guarantee future results. Readers should conduct their own research and consult with a qualified financial advisor before making any investment decisions. TechGaged does not accept liability for any losses incurred based on the information presented.
How do you rate this article?
Subscribe to our YouTube channel for crypto market insights and educational videos.






Join our Socials
Briefly, clearly and without noise – get the most important crypto news and market insights first.
Most Read Today
1
Quantum Threat to Crypto: What Holders Must Do Now
2Cardano Is Still 94% Below Its Peak — What Went Wrong With ADA?
3Solana ETF Shares Could Soon Go On-Chain — Bitwise Is Exploring A Major Shift
4The Next Crypto Investment Wave May Be Bigger Than Bitcoin — Here’s Why
5Chainlink Holders Hit A Record High — Could Price Finally Catch Up?
Latest





8
Also read
Similar stories you might like.
Crypto News
Chainlink Holders Hit A Record High — Could Price Finally Catch Up?
Azeez | 2026-08-15
Altcoins
Whale Watch: Smart Money Is Silently Accumulating These Altcoins
Azeez | 2026-05-02
Altcoins
Dogecoin Awakens After Seventy-Three Days as SpaceX Eyes June IPO
Azeez | 2026-05-01

Altcoins
Dogecoin’s Path to $0.50 in 2026: What Would Actually Need to Happen
Azeez | 2026-04-26
Altcoins
This Key Ethereum Level Has Historically Triggered Explosive Moves
Azeez | 2026-04-24
Altcoins
Safe or Suspect? What Wealthsimple’s Partnership with X Means for DOGE
Azeez | 2026-04-19
Altcoins
Dogecoin Goes Live on Rakuten: Can 44 Million Japanese Users Influence DOGE?
Azeez | 2026-04-17

Altcoins
Massive Fartcoin Long Ends in $3M Loss, Shorts Benefit
Ana | 2026-04-09
Altcoins
Wall Street Meme Coin Push: Canary Capital Files for Spot PEPE ETF
Ana | 2026-04-09
Altcoins
Could SpaceX’s IPO Be the Catalyst That Sends Dogecoin Above $0.10?
Azeez | 2026-03-29