












Bitcoin emblem with a bullish chart background. Source: Techgaged/Shutterstock.

Bitcoin just closed above a major technical line. The weekly candle closed above the 50-week moving average. That hadn’t happened in 45 weeks. Galaxy Research says this signal has historically marked bear market bottoms.
What Actually Happened
Galaxy Research head Alex Thorn posted the data on his X account. Bitcoin closed the week at $81,159 on September 20.
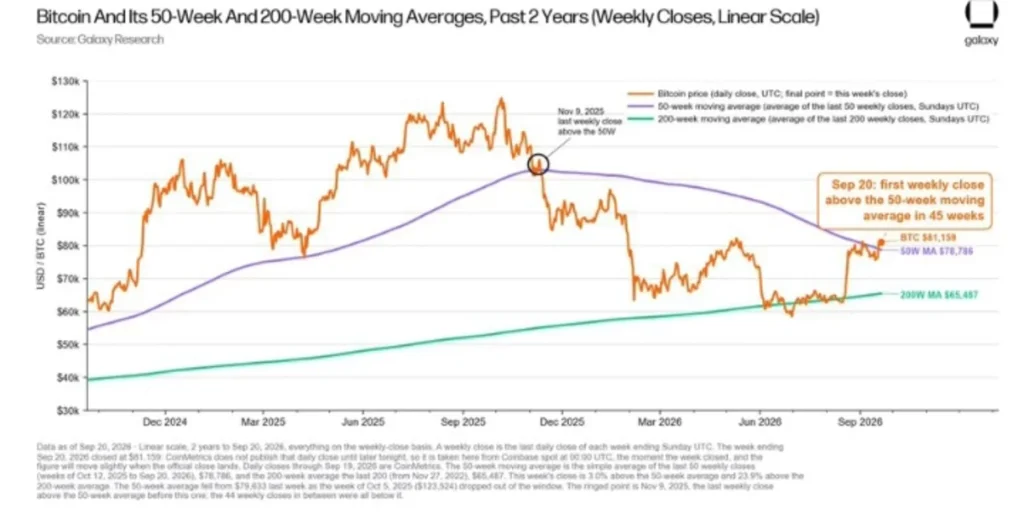
The 50-week moving average sat at $78,786. That’s a close roughly 3% above the line.
Latest Stories

Bitcoin’s Demand Is Holding Strong — One On-Chain Level Could Decide What Comes Next

Chainlink Keeps Stacking LINK — The Reserve Has Crossed $70M

Ethereum Stakers Are Sending a Powerful Signal
The 200-week average sits much lower, at $65,487. Bitcoin hit a cycle low near $58,525 on June 30. It has recovered about 39% since then.
Thorn’s research found 13 similar reclaims since 2011. In 11 of those 13 cases, Bitcoin avoided a new cycle low afterward.
Bitcoin Has Tried This Before and Failed
This level hasn’t always held on the first attempt. Bitcoin corrected to $97,000 back in November 2025, still trading below its 50-week EMA at the time.
Analysts then said bears were still in control. Reclaiming the level looked difficult.
That attempt failed. Bitcoin kept falling for months afterward. This history is a reason for some caution now.
The Two Exceptions Worth Remembering
Not every reclaim has worked. Two of the 13 instances Thorn tracked were followed by lower lows. Both happened during the 2021 to 2022 bear market.
That cycle behaved differently from the rest. It’s the clearest example of this signal failing.
Price Reflects the Full Recovery
BTC trades at $85,458.00 as of 14:03 UTC on September 21, 2026, up 8.9% over seven days, per CoinGecko.
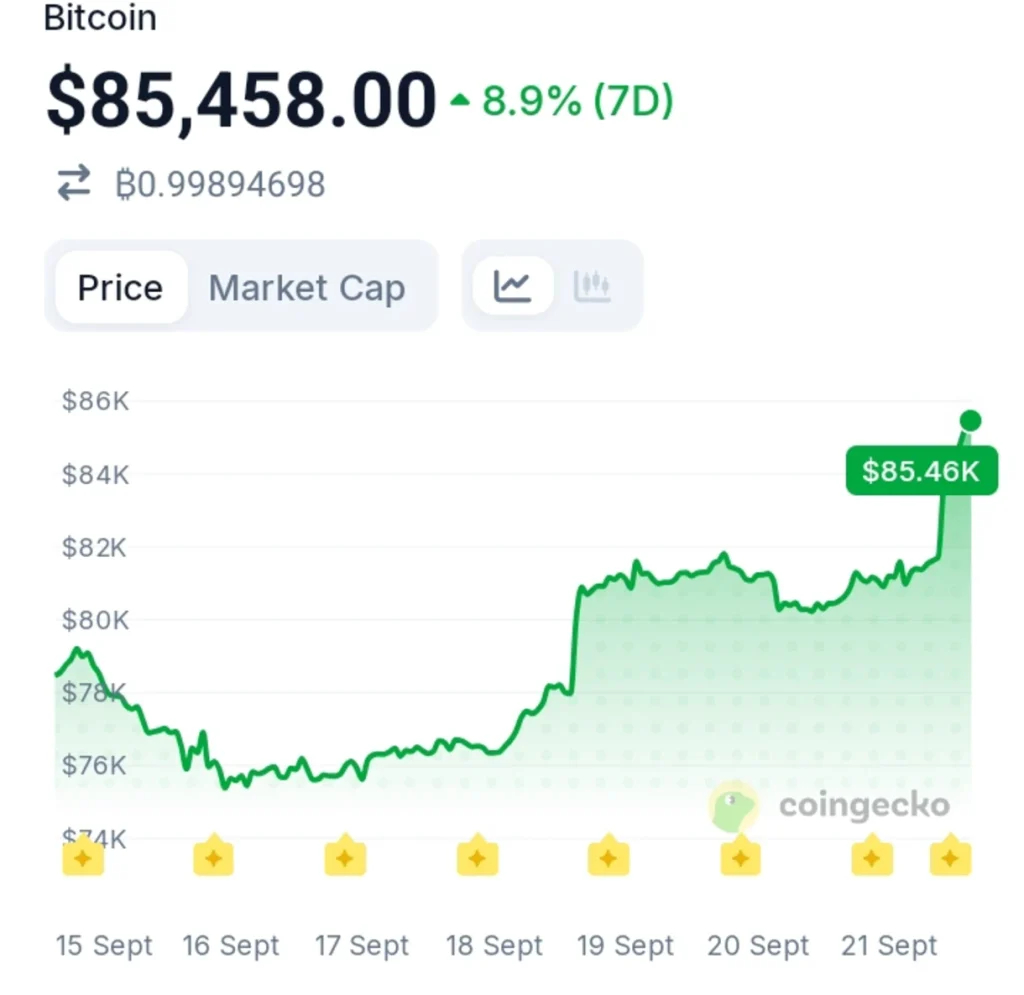
The chart shows a sharp climb from below $76,000 on September 16 to above $85,000 by September 21. That’s a fast move.
Bitcoin’s demand had collapsed sharply back in June, with total demand falling by roughly 652,000 BTC in a single week. This week’s rally looks like a sharp reversal from that earlier weak spot.
What Comes Next
The bull case needs more confirmation. A close above $85,000 by September 27 would strengthen the signal.
A drop back below $78,786 would turn this week’s breakout into a false one. Traders are also watching $83,000 as a level that would break the pattern of lower highs.
With price already testing $85,000 just one day after the weekly close, the next few sessions should show whether this reclaim holds or fades like some past attempts did.
Disclaimer:
This article is for informational purposes only and does not constitute financial, investment, or trading advice. The views expressed are based on publicly available data, market observations, and the author’s interpretation at the time of writing. Cryptocurrency markets are highly volatile and unpredictable, and past performance or current technical setups do not guarantee future results. Readers should conduct their own research and consult with a qualified financial advisor before making any investment decisions. TechGaged does not accept liability for any losses incurred based on the information presented.
How do you rate this article?
Subscribe to our YouTube channel for crypto market insights and educational videos.






Join our Socials
Briefly, clearly and without noise – get the most important crypto news and market insights first.
Most Read Today
1
Ethereum Stakers Are Sending a Powerful Signal
2Sui’s Lending Powerhouse Gets a Glow-Up: The RWA Shift Is Underway
3Bitcoin’s Demand Is Holding Strong — One On-Chain Level Could Decide What Comes Next
4Chainlink Keeps Stacking LINK — The Reserve Has Crossed $70M
5ZEC Keeps Setting New Highs — Even With Its Biggest Concern Still Alive
Latest





8
Also read
Similar stories you might like.

Crypto News
Bitcoin’s Demand Is Holding Strong — One On-Chain Level Could Decide What Comes Next
Azeez | 2026-09-20

Crypto News
Ethereum Stakers Are Sending a Powerful Signal
Azeez | 2026-09-20

Crypto News
Sui’s Lending Powerhouse Gets a Glow-Up: The RWA Shift Is Underway
Azeez | 2026-09-20

Crypto News
Bitcoin Trades Above $80K as Altcoins Explode — Is Risk Appetite Back?
Azeez | 2026-09-19

Crypto News
Bitcoin Traders Went From Euphoria to Fear in Days — The Shift Is Clear
Azeez | 2026-09-18

Crypto News
Solana Could Be Building Toward a Parabolic Move
Azeez | 2026-09-18
Crypto News
ZEC Price Reacts After Zcash Holders Greenlight Major Upgrade
Azeez | 2026-09-17

Crypto News
ETH Is Approaching a Critical Breakout: Popular Analyst Reveals the Level That Matters
Azeez | 2026-09-17

Crypto News
Bitcoin Loses the True Market Mean — The Next Move Could Be Crucial
Azeez | 2026-09-17

Crypto News
Nearly $100M of Bitcoin Just Moved Into MARA: The Timing Matters
Azeez | 2026-09-16