













Physical representation of Solana coins. Source: TechGaged/Shutterstock.

Solana may be quietly building the base for its next major move. On-chain data shows a support floor forming around $100, with more than 40 million SOL traded near that level.
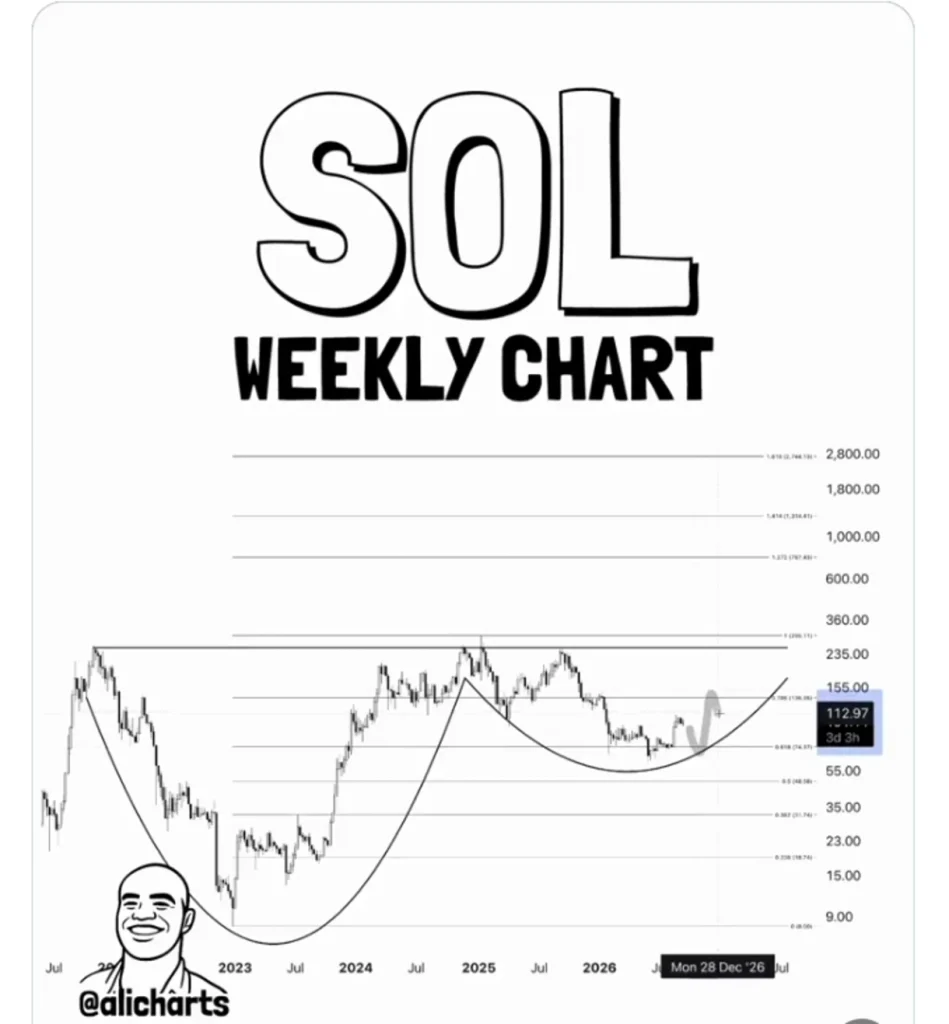
Analyst Ali Charts says the weekly chart may be even more bullish than the support zone suggests.
The Support Floor Holding Up SOL
Ali Charts laid out the setup in detail, pointing to more than 40 million SOL traded near $100 as evidence of a genuine demand zone rather than a temporary pause.
Latest Stories
Ethereum Removes One of Its Biggest Barriers as Fees Approach Record Lows

Bitcoin Traders Went From Euphoria to Fear in Days — The Shift Is Clear

NYSE Is Eyeing Avalanche for 24/7 Onchain Trading: A Major Catalyst for AVAX
The immediate question is whether SOL can hold above that level and convert $105 from resistance into support. A sustained close above $105 could open the door toward $130.
Not Every Analyst Reads This Support the Same Way
Support zones can fail. Techgaged reported earlier this year that a break of a different critical support level could send SOL as low as $24, a reminder that on-chain support clusters don’t guarantee a floor holds under enough selling pressure.
The current $100 zone carries real weight given the trading volume behind it, but it isn’t immune to a broader market downturn.
The Weekly Cup-and-Handle Setup
Zooming out, SOL appears to have spent the last few years building a massive cup-and-handle pattern, with the neckline sitting near $360.
A confirmed breakout above that level could mark the beginning of a much larger expansion toward $1,300.
This is a multi-year scenario, not a near-term forecast, and remains speculative given how far price would need to travel to test it.
The Weekly Chart Shows Momentum Rebuilding
A TradingView weekly chart created on September 18, 2026, at 09:06 UTC shows SOL/USD at $106.09, up 4.50% on the week.
The chart shows a Parabolic SAR flip below price, and MACD reading 5.56 against a signal line of -0.30, with the histogram turning positive after months in the red.
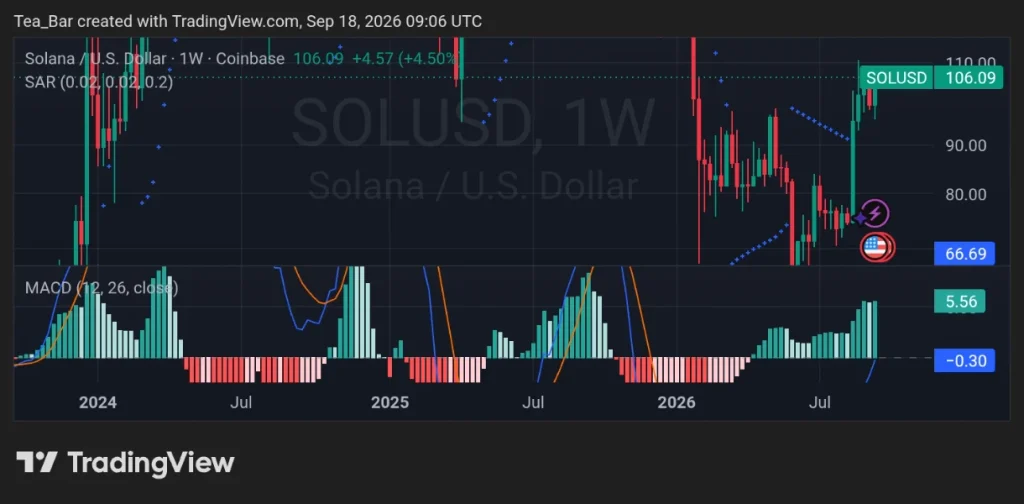
The current setup, with a defined support floor and improving momentum, marks a clear shift from that earlier divergence.
What Happens From Here
The near-term path likely hinges on whether SOL can turn $105 into support and push toward $130.
The $360 neckline and $1,300 target remain distant markers, but a clean reclaim of the nearer levels would be the first real confirmation that Solana’s longer-term structure is starting to play out.
Disclaimer:
This article is for informational purposes only and does not constitute financial, investment, or trading advice. The views expressed are based on publicly available data, market observations, and the author’s interpretation at the time of writing. Cryptocurrency markets are highly volatile and unpredictable, and past performance or current technical setups do not guarantee future results. Readers should conduct their own research and consult with a qualified financial advisor before making any investment decisions. TechGaged does not accept liability for any losses incurred based on the information presented.
How do you rate this article?
Subscribe to our YouTube channel for crypto market insights and educational videos.






Join our Socials
Briefly, clearly and without noise – get the most important crypto news and market insights first.
Most Read Today
1
ZEC Price Reacts After Zcash Holders Greenlight Major Upgrade
2ETH Is Approaching a Critical Breakout: Popular Analyst Reveals the Level That Matters
3Over $16 Trillion in Payments Could Reach Onchain Rails — Chainlink Is Behind the Connection
4Clarity Act 2026: Everything You Should Know
5Bitcoin Loses the True Market Mean — The Next Move Could Be Crucial
Latest





8
Also read
Similar stories you might like.

Crypto News
Bitcoin Traders Went From Euphoria to Fear in Days — The Shift Is Clear
Azeez | 2026-09-18
Crypto News
ZEC Price Reacts After Zcash Holders Greenlight Major Upgrade
Azeez | 2026-09-17

Crypto News
ETH Is Approaching a Critical Breakout: Popular Analyst Reveals the Level That Matters
Azeez | 2026-09-17

Crypto News
Bitcoin Loses the True Market Mean — The Next Move Could Be Crucial
Azeez | 2026-09-17
Crypto News
Stablecoin Activity on Solana Is Accelerating — The Next Phase Could Be Bigger
Azeez | 2026-09-16

Crypto News
This New Discovery Shows That Ethereum Market May Be Entering a New Territory
Azeez | 2026-09-15

Crypto News
U.S. Crypto ETFs Pulled in $281M: Institutional Money Is Returning
Azeez | 2026-09-15
Crypto News
Multicoin Capital Moves Millions More in HYPE — Is Selling Pressure Building?
Azeez | 2026-09-15

Crypto News
A National Digital Identity System Is Now Using Avalanche — The Scale Is Huge
Azeez | 2026-09-15

Crypto News
Solana’s dApp Economy Is Back Near Its 2025 Peak — The Next Move Matters
Azeez | 2026-09-14