















Bitcoin Cash logo on screen next to a circuit board. Source: TechGaged / Shutterstock.
BCH Jumps Before CME Futures Go Live — Institutional Money or Something Else?

Bitcoin Cash just had one of its wildest weeks of the year. Price surged nearly 50% in seven days.
The move came right after CME Group confirmed a launch date for regulated BCH futures.
The question now is whether this is real institutional positioning or just speculative froth running ahead of the news.
Latest Stories
Bitcoin May Soon Have Private Transfers Without Changing Its Core Rules

ETH Is Leaving Exchanges at a Record Pace — Here’s Where the Supply Is Going

$ZCSH Hits $1B AUM as Grayscale Doubles Down on Zcash Exposure
What CME Announced
CME Group’s press release confirms the launch details. Bitcoin Cash and Uniswap futures go live October 19, pending regulatory review.
Standard BCH contracts will represent 250 BCH. Micro contracts will cover 25 BCH. The launch expands CME’s crypto lineup to ten single-asset products, following earlier additions like Cardano, Chainlink, Stellar, Avalanche, and Sui.
BCH Doesn’t Usually Move Like This
Bitcoin Cash typically trades as a smaller, quieter shadow of Bitcoin’s own price action. BCH rose just 1.7% during a broader altcoin rally back in May, a modest move compared to HYPE’s 20% and ZEC’s 14% gains that same day.
This week’s nearly 50% surge is far outside that typical pattern, which is exactly why the CME announcement stands out as the clear catalyst.
The Leverage Story Behind the Price Move
Sanbase’s open interest chart tracks this data directly, and the same explorer covers BCH derivatives venues. Open interest nearly doubled on the day CME made its announcement.
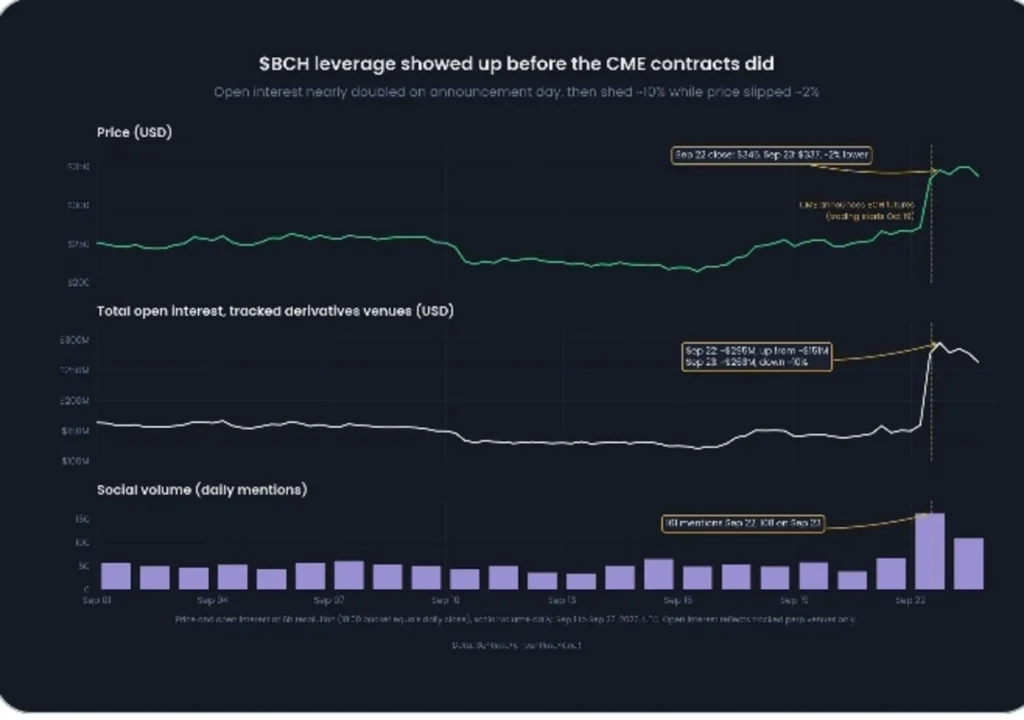
It then shed about 10% while price slipped roughly 2%. Social volume spiked sharply alongside the leverage, with daily mentions jumping well above their recent baseline.
That sequence, leverage building before the CME contracts even started trading, suggests speculative positioning got ahead of any real institutional flow.
Weekly Chart Shows a Sharp Reversal From the Highs
A TradingView weekly chart created on September 25, 2026, at 06:54 UTC shows BCH/USD at $332.23.
The chart’s high sits at $686.80, a level from well over a year ago that price has never approached since.
The recent low bottomed near $140.97 before this week’s sharp rebound. RSI sits at 53.43, above its 35.73 moving average, showing genuine momentum returning after months of weakness.
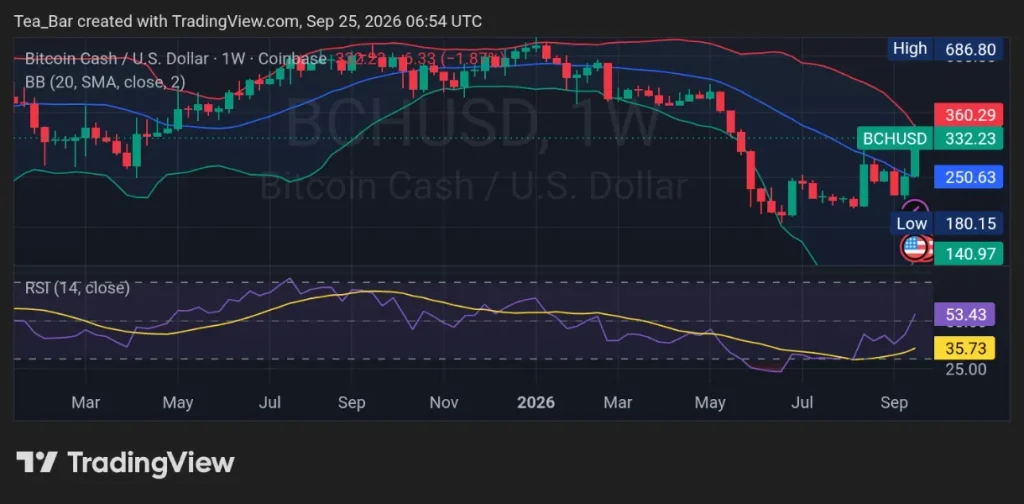
Price remains far below its historic high, even after this week’s outsized move.
What Happens Between Now and October 19
BCH has also been among the sharpest decliners during broader market selloffs before, dropping more than 7% in a single session earlier this year, a reminder of how quickly sentiment can reverse for this token.
With three weeks left before CME’s contracts actually launch, the real test comes once the leverage that built this rally either gets confirmed by genuine institutional demand or unwinds just as fast as it arrived.
Disclaimer:
This article is for informational purposes only and does not constitute financial, investment, or trading advice. The views expressed are based on publicly available data, market observations, and the author’s interpretation at the time of writing. Cryptocurrency markets are highly volatile and unpredictable, and past performance or current technical setups do not guarantee future results. Readers should conduct their own research and consult with a qualified financial advisor before making any investment decisions. TechGaged does not accept liability for any losses incurred based on the information presented.
How do you rate this article?
Subscribe to our YouTube channel for crypto market insights and educational videos.






Join our Socials
Briefly, clearly and without noise – get the most important crypto news and market insights first.
Most Read Today
1
A Critical Zcash Upgrade Is Coming: Some ZEC Could Become Unspendable
2Solana’s RWA Surge Hits Another Record as Total Value Tops $4.6B
3A Major Enterprise Door Opens for HBAR as IBM Cloud Lists IDTrust
4Bitcoin’s $18B Options Expiry Is Coming — A Major Market Move Could Follow
5XRP Breaks a Seven-Month Barrier as Whale Activity Hits a Fresh High
Latest





8
Also read
Similar stories you might like.

Crypto News
ETH Is Leaving Exchanges at a Record Pace — Here’s Where the Supply Is Going
Azeez | 2026-09-25

Crypto News
Bitcoin’s $18B Options Expiry Is Coming — A Major Market Move Could Follow
Azeez | 2026-09-24

Crypto News
XRP Breaks a Seven-Month Barrier as Whale Activity Hits a Fresh High
Azeez | 2026-09-23

Crypto News
BlackRock’s Bitcoin Buying Hits Another Level
Azeez | 2026-09-23

Crypto News
Bitcoin Passes a Major Historical Test — A New Phase May Be Emerging
Azeez | 2026-09-21

Crypto News
Bitcoin’s Demand Is Holding Strong — One On-Chain Level Could Decide What Comes Next
Azeez | 2026-09-20

Crypto News
Ethereum Stakers Are Sending a Powerful Signal
Azeez | 2026-09-20

Crypto News
Sui’s Lending Powerhouse Gets a Glow-Up: The RWA Shift Is Underway
Azeez | 2026-09-20

Crypto News
Bitcoin Trades Above $80K as Altcoins Explode — Is Risk Appetite Back?
Azeez | 2026-09-19

Crypto News
Bitcoin Traders Went From Euphoria to Fear in Days — The Shift Is Clear
Azeez | 2026-09-18