












Golden Bitcoin token displayed against a blurred candlestick chart background. Source: TechGaged / Shutterstock.
Over $300M In Bitcoin Shorts Liquidated As BTC Breaks Higher — What’s Next?

Bitcoin just tore through weeks of sideways trading in a matter of hours. The catalyst wasn’t a crypto headline at all. It came from the U.S. Treasury, and traders betting against Bitcoin paid the price fast.
What Actually Sparked The Move
The U.S. Treasury announced on August 19 that it will at least double the amount of longer-term government bonds it buys back, raising the figure from $2 billion to at least $4 billion per operation starting September 9.
Announcements like this tend to make risky assets more attractive, and crypto reacted almost immediately.
Latest Stories

Grayscale’s Latest Move: Is This The Institutional Moment Zcash Has Been Waiting For?

Is DeFi Really Dead After This Brutal 50% Crash?

The Quiet Metric That Could Spark Hedera’s Next Move
Bitcoin jumped to $67,983.35, up 5.5% on the day, while Ethereum climbed 9% to $2,078.44 and Solana rose 5.5% to $81.16.
The Squeeze That Followed
Rising prices forced short sellers to cover fast, and that covering pushed prices higher still.
Total crypto liquidations reached $1.91 billion over 24 hours as of 5:00 p.m. UTC, with short positions accounting for more than 91% of that total.
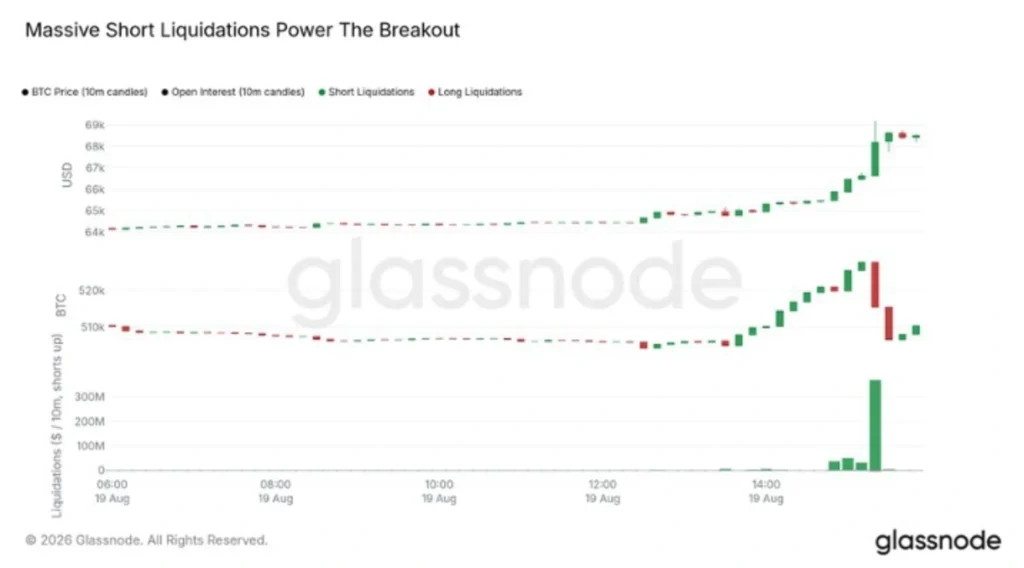
Bitcoin alone briefly surged more than 7% in just 60 minutes, wiping out $1.2 billion in shorts during that single window and pushing the token to its highest level since early June.
A Move Bitcoin Has Made Before
This isn’t the first time geopolitical or macro headlines have triggered a short squeeze of this size on Bitcoin.
Techgaged reported in April that a similar spike toward $80,000 wiped out more than $140 million in shorts within hours after news broke of a potential U.S.-Iran deal over the Strait of Hormuz, though that rally reversed sharply soon after.
A separate move later that same month saw Bitcoin climb to an 11-week high above $79,000, with roughly $460 million in liquidations hitting mostly short positions as a ceasefire extension shifted sentiment toward risk assets.
Fast squeezes like today’s tend to fade quickly once the initial catalyst gets priced in.
Where BTC Stands On The Chart
As of 18:23 UTC on August 19, 2026, BTC/USD trades at $68,276.88 on the weekly chart, up 5.56%.
Price has broken decisively above the $63,000 resistance zone that capped it for most of August.
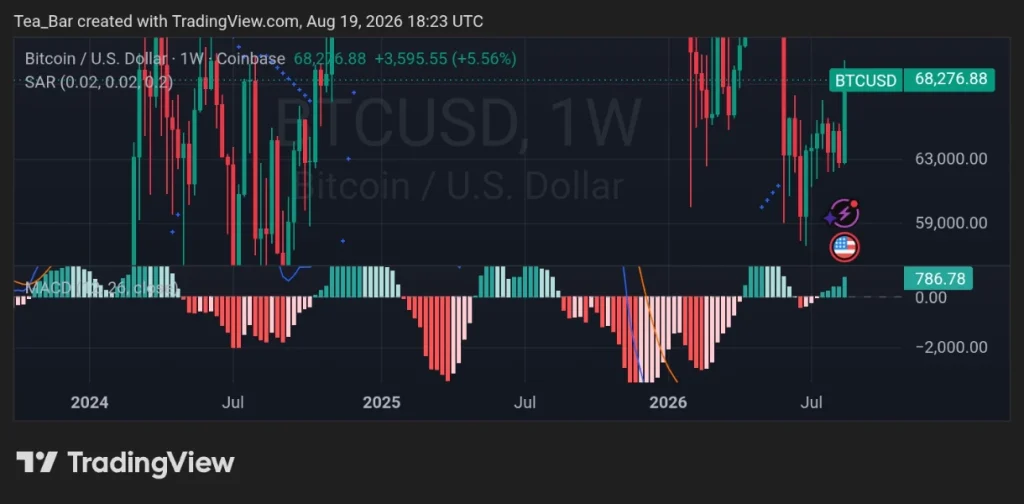
Also, the weekly MACD histogram has flipped firmly positive after months of choppy, mixed readings.
That combination, a sharp breakout paired with a fresh momentum shift, hasn’t shown up together on this chart since the rally into late 2025.
Whether this breakout holds and builds into a sustained trend, or whether the market needs to cool off after such a fast squeeze, is what traders will be watching in the sessions ahead.
Disclaimer:
This article is for informational purposes only and does not constitute financial, investment, or trading advice. The views expressed are based on publicly available data, market observations, and the author’s interpretation at the time of writing. Cryptocurrency markets are highly volatile and unpredictable, and past performance or current technical setups do not guarantee future results. Readers should conduct their own research and consult with a qualified financial advisor before making any investment decisions. TechGaged does not accept liability for any losses incurred based on the information presented.
How do you rate this article?
Subscribe to our YouTube channel for crypto market insights and educational videos.






Join our Socials
Briefly, clearly and without noise – get the most important crypto news and market insights first.
Most Read Today
1
Bitcoin Volatility Hits A Rare Extreme — A Bigger Move Could Be Coming
2Ethereum’s Biggest Test Yet Begins On August 20
3Smart Contract Audits: What Teams Need to Verify Code
4Sui Is Quietly Building A Bitcoin Powerhouse — The Latest Numbers Tell The Story
5BitMine Won’t Stop Buying Ethereum — Tom Lee Now Eyes 5% Of Total Supply
Latest





8
Also read
Similar stories you might like.

Crypto News
The Quiet Metric That Could Spark Hedera’s Next Move
Azeez | 2026-08-19

Crypto News
A Nasdaq Firm Backs US Bitcoin Treasury With 2,100 BTC — Bullish?
Azeez | 2026-08-19

Crypto News
BNB Just Flashed a Whale Accumulation Signal Not Seen Since the Last Pump
Azeez | 2026-08-18

Crypto News
Three Korean Banks In One Year — Is Ripple Setting XRP Up For Liftoff?
Azeez | 2026-08-18

Crypto News
BitMine Won’t Stop Buying Ethereum — Tom Lee Now Eyes 5% Of Total Supply
Azeez | 2026-08-18
Crypto News
Bitcoin Volatility Hits A Rare Extreme — A Bigger Move Could Be Coming
Azeez | 2026-08-18
Crypto News
Strategy Is Selling Bitcoin Instead Of Buying — Should Investors Be Worried?
Azeez | 2026-08-17

Crypto News
Goldman Sachs XRP ETF Claim Resurfaces — But The Numbers Look Familiar
Azeez | 2026-08-16
Crypto News
Crypto Markets Get A Major Regulatory Boost Even Without CLARITY Act Passage
Azeez | 2026-08-16

Crypto News
Cardano Is Still 94% Below Its Peak — What Went Wrong With ADA?
Azeez | 2026-08-16