










Glowing financial candlestick chart rising through dramatic, colorful clouds and dark space. Source: TechGaged / Shutterstock.

Hedera just set a network record most traders scrolled right past. Daily transactions hit a new all-time high this month, yet HBAR’s price hasn’t budged much to match it.
The Record Itself
Hedera’s network averaged 291,200 transactions per day over the past two weeks, and peaked at 346,943 transactions on August 12, an all-time high, according to a post by crypto commentator AllInCrypto.
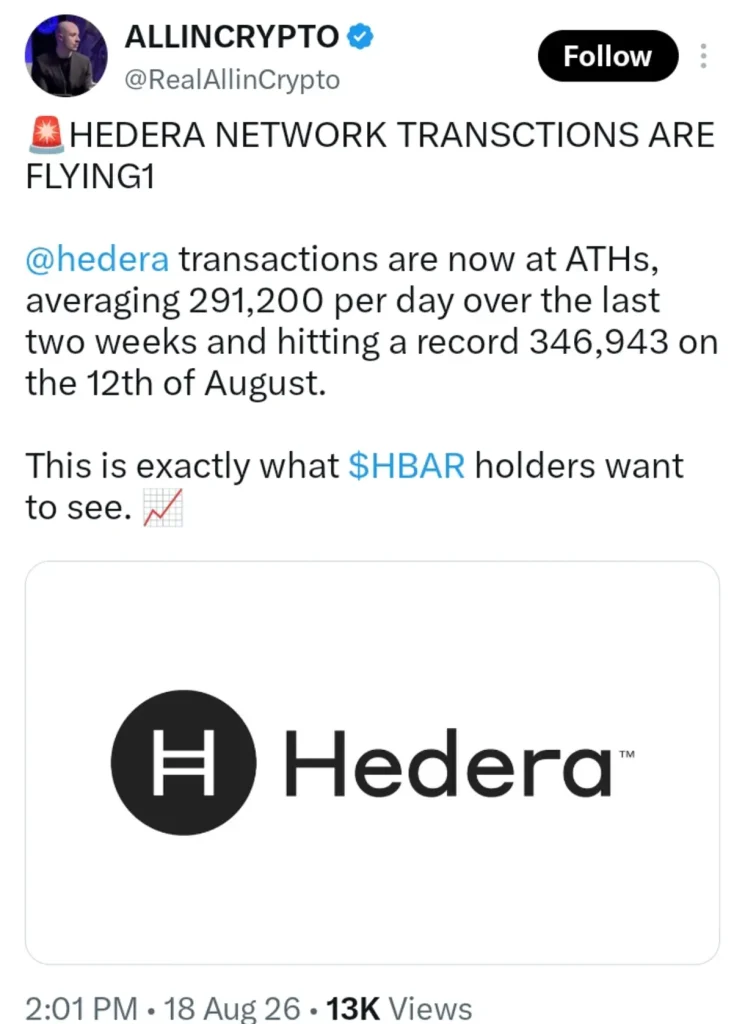
That kind of throughput reflects Hedera’s engineered design for high-volume, low-cost enterprise use, CoinMarketCap’s data desk noted, pointing to applications like supply chain tracking as a steady driver behind the surge.
Latest Stories
Wall Street’s Blockchain Switch Is Arriving: DTCC Tokenization Service Targets October Launch

Gold Can Now Earn Gold On-Chain — Paxos Labs Opens Bullion Lending With PAXGy

Bitcoin Mining Pools Could Hide Payout Addresses Without a Soft Fork
Total value locked on the network also climbed 5.2% over the same seven-day window, reaching $20.6 million.
Why Usage And Price Keep Splitting Apart
This gap between activity and price isn’t new for Hedera. Sustained network usage validates the platform’s enterprise-grade design, but rising transaction counts alone haven’t historically translated into fast price appreciation without matching token demand.
HBAR currently sits well below its all-time high of $0.5701, even with usage climbing toward record territory.
Analysts tracking the token describe the setup as split: short-term technicals look constructive, while the broader trend remains down.
The Enterprise Pipeline Behind The Numbers
Techgaged has tracked Hedera’s institutional build-out for months. Back in March, McLaren Racing joined Hedera’s Governing Council, giving the Formula One team a direct role in shaping the network’s technical roadmap.
Techgaged has separately flagged Hedera’s push into AI infrastructure too, noting how the network’s Agent Lab platform ties every autonomous AI transaction to HBAR consumption, a source of utility-driven demand that sits apart from pure market speculation.
Reading The Weekly Setup
As of 09:46 UTC on August 19, 2026, HBAR/USD trades at $0.06755152 on the weekly chart, up 0.38%.
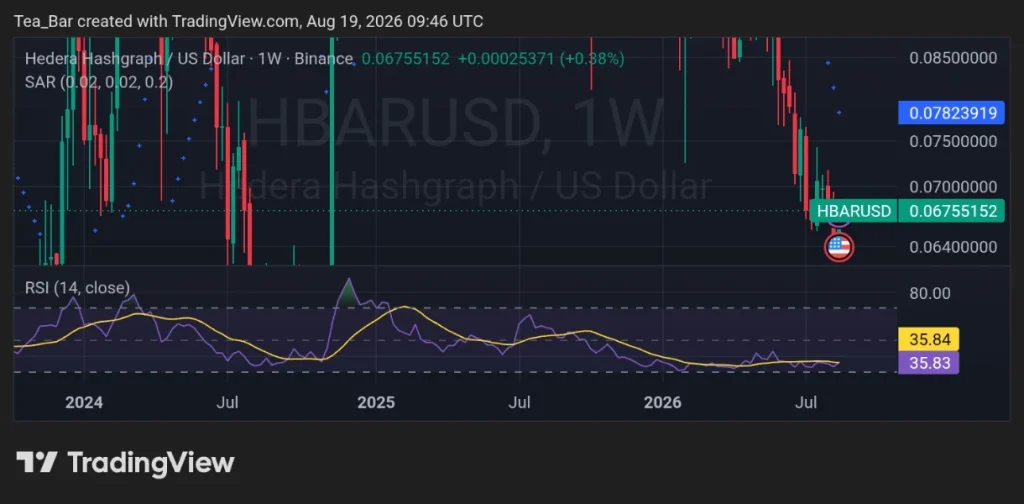
Price has fallen sharply from highs above $0.085 in July and now sits near a multi-month low.
The weekly RSI reads 35.84, still on the softer side of neutral, though it has climbed off deeper lows earlier this month, a sign selling pressure may be starting to fade even as the broader trend stays down.
A push back above 50 would mark a more decisive shift toward neutral-to-bullish footing.
Does record network usage eventually pull HBAR’s price along with it, or does this remain another case of strong fundamentals waiting on the market to notice?
Disclaimer:
This article is for informational purposes only and does not constitute financial, investment, or trading advice. The views expressed are based on publicly available data, market observations, and the author’s interpretation at the time of writing. Cryptocurrency markets are highly volatile and unpredictable, and past performance or current technical setups do not guarantee future results. Readers should conduct their own research and consult with a qualified financial advisor before making any investment decisions. TechGaged does not accept liability for any losses incurred based on the information presented.
How do you rate this article?
Subscribe to our YouTube channel for crypto market insights and educational videos.






Join our Socials
Briefly, clearly and without noise – get the most important crypto news and market insights first.

Most Read Today
1
AI Traces $387M Bitget Heist to North Korea as 2026 Losses Cross $1B
2Tokenization firm VerifyMe Rebrands to OpenWorld After NASDAQ Debut
3BlackRock Bitcoin Trust Gains Allie Family Office Investment
4Most explosive Bitcoin signal just appeared on the monthly chart
5ADA ETF Decision Nears — One SEC Date Could Trigger a Market Shakeup
Latest






8
Also read
Similar stories you might like.
Blockchain
Hedera Is Removing Smart Contract Calls From Atomic Batches — Developers Have Until March 2027
TechGaged | 2026-10-04
Blockchain
Hedera Moves Its Bridgeless Cross-Ledger Protocol Into the Linux Foundation
TechGaged | 2026-10-04
Blockchain
Hedera Quietly Completes v0.77.5 Mainnet Upgrade — Here’s What Changed
TechGaged | 2026-10-04

Crypto News
October Fed Hike Odds Slip to 45% — Crypto Traders Are Watching Closely
Azeez | 2026-09-30

Crypto News
Bitcoin Whales Reach Highest Holdings Since August — The Setup Changes
Azeez | 2026-09-30

Crypto News
A Fresh Wallet Withdraws 9,132 ETH — Preparing for a Bigger Move?
Azeez | 2026-09-29

Crypto News
Goldman Sachs Connects $100B to Avalanche: AVAX Has a New Institutional Catalyst
Azeez | 2026-09-29
Crypto News
Binance’s Bitcoin Reserves Plunge — Are Late Buyers Finally Feeling FOMO?
Azeez | 2026-09-28
Crypto News
Bitcoin Repeats a Rare Q3 Pattern — Could Q4 Bring Another Explosive Rally?
Azeez | 2026-09-27

Crypto News
Chainlink Reserve Crosses 6 Million LINK — What This Means for the Token
Azeez | 2026-09-26