


Bitcoin tokens with neon lighting. Source: TechGaged / Shutterstock.
Bitcoin Supply Overhang Is Dragging On, Data Shows — What’s Next?
In Brief
- • Long-term holders hold 5.6M BTC at a loss.
- • $60K is the key Bitcoin support level.
- • Past cycles show recovery often follows supply stress.

The metric that matters most during a downturn is not how far price has fallen. It is how many people are sitting on losses — and whether they are close to capitulating.
Right now, that number has reached a level not seen since the early days of the Covid crash in March 2020.
Glassnode data published on June 27, 2026 reveals that long-term Bitcoin holders are now carrying 5.6 million BTC at a loss.
Latest Stories
A Massive Shift Is Taking Place Inside the Chainlink Network

Stellar Reaches $3 Billion in Tokenized Real-World Assets

Down $1.7B, SharpLink Resumes Buying Ethereum
That is the highest figure recorded since the Covid-driven market collapse over six years ago.
Glassnode’s own assessment of this data is direct: the resolution of overhang supply is extending, not concluding.
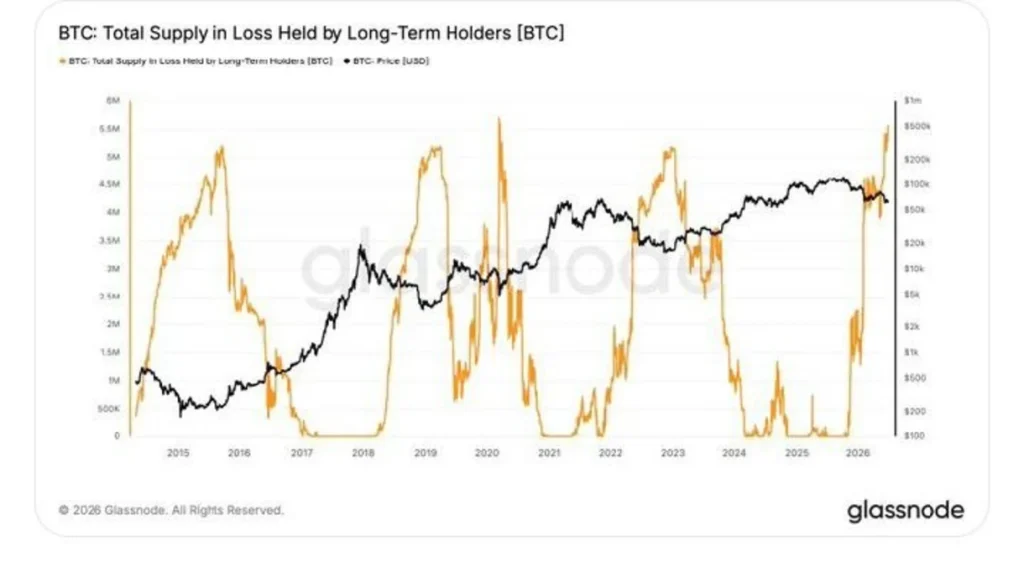
In plain terms, the process of long-term holders absorbing their losses and either selling or holding through them has more runway ahead of it, not less.
What 5.6 Million BTC at a Loss Actually Means
Long-term holders are defined as wallets that have held Bitcoin for at least 155 days without moving it.
These are not traders. They are patients investors who made a deliberate decision to hold through multiple market cycles.
When 5.6 million BTC in this cohort sits at an unrealised loss, it creates what analysts call overhang supply — a ceiling of potential selling pressure from holders who may eventually exit if conditions deteriorate further or if patience runs out.
The historical Glassnode chart shows that previous peaks in long-term holder losses — in 2018, 2020, and 2022 — each preceded significant recoveries.
But each also came after the overhang resolved, not before. Glassnode’s language today — extending, not concluding — is a precise and deliberate caution against calling a bottom prematurely.
Thirty Days That Erased $15,000 Per Coin
Data pulled from CoinGecko on June 27, 2026 at approximately 14:30 UTC shows Bitcoin trading at $60,360.74, down 17.2% over thirty days.
The 30-day chart makes the scale of this decline viscerally clear. Bitcoin opened May 29 near $75,000 — a level that now looks distant.
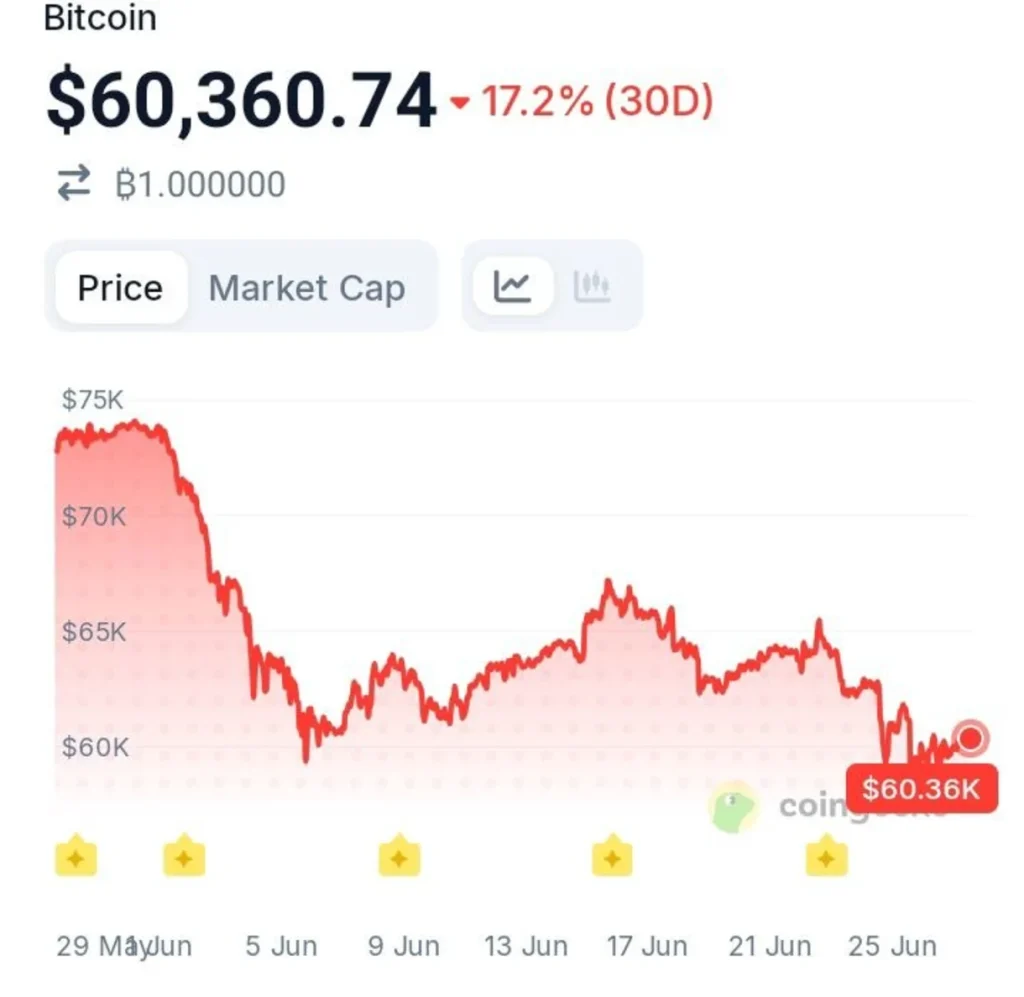
Then it sold off in a near-continuous decline through June, pausing briefly in the $62K–$65K range mid-month before another leg lower brought it to current levels around $60K.
The chart has the structure of exhausted sellers meeting reluctant buyers — no sharp V-shaped recovery, no aggressive bounce, just a slow grind along the lower boundary of what was once a major support zone.
Three Signals Worth Watching
The Glassnode data, combined with the price structure, creates a framework for what to monitor going forward.
First, watch whether the 5.6 million BTC loss figure continues climbing — if it does, the overhang is worsening.
If it stabilises or begins declining, it signals that long-term holders are either accumulating at lower prices or that selling pressure is finally exhausting itself.
Second, the $60K level is now both a psychological and structural threshold. Every day Bitcoin holds above it, the case for a base forming strengthens slightly.
Third, historical recovery timelines from comparable long-term holder loss peaks suggest that once the overhang resolves, recoveries have been sharp and sustained.
None of this means the bottom is confirmed. Glassnode’s own framing rules that out for now.
But 5.6 million BTC at a loss, held by people who have historically refused to sell through prior crashes, is not a picture of a market about to collapse further.
It is a picture of a market in the final, most uncomfortable phase of a bear cycle — where the data is at its darkest and the opportunity is historically at its most significant.
Whether this is the bottom or a waypoint on the way lower is the question. But the long-term holders carrying 5.6 million BTC in losses are not selling yet. And in every previous cycle, that group has ultimately been right to wait.
Disclaimer:
This article is for informational purposes only and does not constitute financial, investment, or trading advice. The views expressed are based on publicly available data, market observations, and the author’s interpretation at the time of writing. Cryptocurrency markets are highly volatile and unpredictable, and past performance or current technical setups do not guarantee future results. Readers should conduct their own research and consult with a qualified financial advisor before making any investment decisions. TechGaged does not accept liability for any losses incurred based on the information presented.
How do you rate this article?
Subscribe to our YouTube channel for crypto market insights and educational videos.


Join our Socials
Briefly, clearly and without noise – get the most important crypto news and market insights first.
Most Read Today
1
Stellar Reaches $3 Billion in Tokenized Real-World Assets
2The Market Event Every Crypto Trader Is Watching
3Aave Fires Back at Kraken Report, Denies Selling Tokens at a 70% Discount
4Bitcoin Dips Below $59K as ETFs Let Go of $696 Million and Options Expire
5BitGo Cuts Jobs to Prioritize AI and Stablecoins
Latest


8
Also read
Similar stories you might like.

Crypto News
Bitcoin’s Next Move May Not Depend on Tech Stocks Anymore
Azeez | 2026-06-25

Crypto News
The Bitcoin Treasury Boom Shows No Signs of Slowing
Azeez | 2026-06-23

Crypto News
Franklin Templeton’s Bitcoin Strategy Could Reshape Portfolio Investing
Azeez | 2026-06-21
Crypto News
Bitcoin ETFs Are Selling — Except for One Major Player
Azeez | 2026-06-20

Crypto News
Bitcoin’s Biggest Players Are Preparing for Something
Azeez | 2026-06-18

Crypto News
What Does BlackRock’s New Bitcoin ETF Mean for BTC’s Future?
Azeez | 2026-06-17

Crypto News
Peter Brandt Spots a Huge Market Opportunity — Will Crypto Benefit?
Azeez | 2026-06-15

Crypto News
Geopolitical Pressure Could Be Turning Into a Market Opportunity for Investors
Azeez | 2026-06-14

Crypto News
BlackRock Drops Another Bitcoin Bombshell Ahead of Nasdaq Debut
Azeez | 2026-06-13

Crypto News
Global Markets Face New Threat After Iran’s Latest Move
Azeez | 2026-06-11