










Hands arranging altcoin market printouts on desk

Altcoin season is confirmed when the Altcoin Season Index reads 75 or higher, meaning at least 75% of the top 50 or top 100 coins have outperformed Bitcoin over the trailing 30 or 90 days. A reading below 25 means Bitcoin is dominating; anything in between is a mixed or transitional market.
To check right now, run three quick tests:
Latest Stories
Bitcoin’s Next Big Test Emerges As $5B In IBIT Options Near Expiry

Bitwise’s SOL Buying Spree Nears A Major $1B Milestone

Chainlink Scores A Major Win As Coinbase Expands Tokenized Stocks
- Index score: Is a live Altcoin Season Index reading above 75?
- Bitcoin dominance (BTC.D): Is it trending down, not just dipping for a day?
- Breadth: What share of the top 50 altcoins have beaten BTC over the past 30 days?
Pro Tip: An index score only tells you what already happened. It confirms a rotation in progress — it doesn’t predict whether one is about to start.
TL;DR:
- An altcoin season is confirmed only when the index score exceeds 75 percent, using a selected universe of the top 50 or 100 coins over 30 or 90 days.
- Stablecoins and wrapped or staked tokens are excluded from the calculation to prevent skewing the index with non-independent assets.
- A sustained decline in Bitcoin dominance alongside rising altcoin breadth, ETH/BTC, and volume signals a higher probability of a true altcoin rotation.
- Altcoin seasons tend to last from several weeks up to a few months, typically ending quickly once profit-taking shifts capital back into Bitcoin or stablecoins.
- The index score reflects past performance and should be combined with other signals for reliable timing, as it does not forecast future market turns.
What Altcoin Season Actually Means
Altcoin season describes a market phase where capital rotates out of Bitcoin and into smaller-cap tokens, producing broad gains across altcoins rather than isolated pumps. Analysts define it operationally: a coin counts as an “altcoin” for index purposes if it’s a tradable token outside Bitcoin itself, though most indexes carve out a few categories to keep the math honest.
Standard exclusions include:
- Stablecoins (USDT, USDC), since they don’t fluctuate in price against BTC.
- Wrapped or pegged assets (WBTC), which just mirror Bitcoin’s own performance.
- Liquid staking derivatives (stETH and similar), for the same reason.
Leaving these in would inflate the index with tokens that aren’t independent speculative bets, which is exactly what the Altcoin Season Index methodology is built to avoid. A shared definition matters because “altcoin season” gets used loosely online. Having one operational standard lets you compare today’s reading against past cycles instead of guessing.
How Do Altcoin Season Indexes Actually Work?
The core calculation is simple: count how many coins in a defined universe (usually the top 50 or top 100 by market cap) have outperformed Bitcoin’s price return over a set rolling window, then express that as a percentage.
- Pick the universe. Top 50 is more sensitive to a handful of large-cap alts moving; top 100 captures broader participation but reacts slower.
- Pick the window. A 30 day window is fast and noisy, reacting to short rallies. A 90 day window smooths spikes and better reflects a genuine regime shift.
- Apply the threshold. A reading of 0 to 25 signals Bitcoin season. 25 to 75 is neutral or transitional. 75 and above is classified as altcoin season.
Exclusions matter here too. Because stablecoins and wrapped tokens are stripped out before the count runs, a market where only pegged assets are moving won’t falsely register as an altseason.
Pro Tip: Check both the 30 day and 90 day readings side by side. When they diverge sharply, the shorter window is usually catching a temporary spike rather than a real rotation.
What Signals Confirm an Altcoin Season?
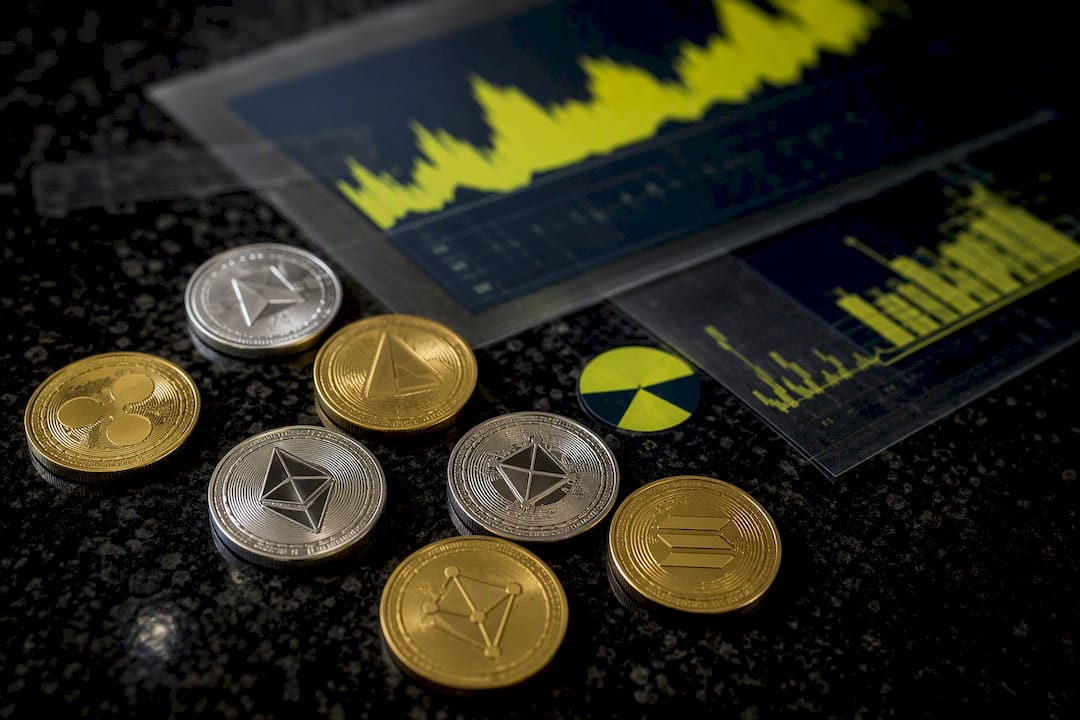
Bitcoin dominance (BTC.D), the share of total crypto market cap held by BTC, is the fastest single chart to check. A sustained break below a prior support level on BTC.D usually lines up with alts gaining ground, while a bounce off support often means Bitcoin is reasserting itself.
Beyond dominance, watch:
- Market breadth: the raw percentage of top alts beating BTC, plus broader gauges like TOTAL2 and TOTAL3 (total market cap excluding BTC, and excluding both BTC and ETH).
- Pair performance: ETH/BTC trending upward is one of the more reliable early tells, since Ethereum typically leads capital rotation before smaller-cap tokens follow.
- Volume and liquidity: rising spot volume, expanding futures open interest, and stablecoin inflows into exchanges often show up before a broad altcoin move gets underway, based on Cointelegraph’s analysis of altseason drivers.
None of these signals works in isolation. A breadth reading of 75%+ built on thin volume across a handful of small caps tells a very different story than the same reading backed by strong spot and futures activity. Techgaged has tracked how ETH’s relative strength against other top assets often foreshadows broader altcoin participation.
Why Do Altcoin Seasons Start and How Long Do They Last?
The typical sequence starts with Bitcoin rallying hard, then consolidating. That consolidation phase is where the rotation usually begins: traders who took profits near a BTC high start redeploying capital into higher-beta altcoins in search of larger percentage moves, and that flow accelerates as more smart contract platforms see rising activity.
Several forces tend to line up at once:
- Profit-taking off a Bitcoin rally frees up capital looking for a new home.
- Narrative shifts (a new DeFi trend, a Layer 2 cycle, an AI-token wave) give that capital a destination.
- Rising overall risk appetite makes traders comfortable moving down the market-cap curve.
This is consistent with the rally-then-rotation pattern seen across past cycles. Duration varies widely. Acute phases have historically run anywhere from a few weeks to a few months, based on past index snapshots, and they often end just as fast as they began, once profit-taking in alts triggers a rotation right back into Bitcoin or stablecoins.
How to Track Altcoin Season: A Daily Workflow
Checking index scores once a week isn’t enough during a fast-moving rotation. Build a five-minute daily habit instead.
- Check the index score on a live tracker like BlockchainCenter’s Altcoin Season Index.
- Glance at BTC.D for direction, not just the day’s number.
- Watch three alt pairs against BTC (typically ETH, plus two sector leaders you follow).
- Scan a volume heatmap across top exchanges for unusual spikes.
Set alerts rather than watching charts all day: an index crossing above 75, a BTC.D break below a defined support level, and a volume spike of two or three times a coin’s daily average are all reasonable triggers. Techgaged has covered how specific Bitcoin indicators have historically preceded rotation, and past historical data on altseason timing is worth reviewing before you size any position.
Pro Tip: Treat the index as one confirmation among several, never the sole trigger. An index reading above 75 paired with weak volume is a weaker signal than a reading of 60 backed by strong breadth and rising ETH/BTC.
Trading Altcoin Season: Position Sizing and Common Mistakes
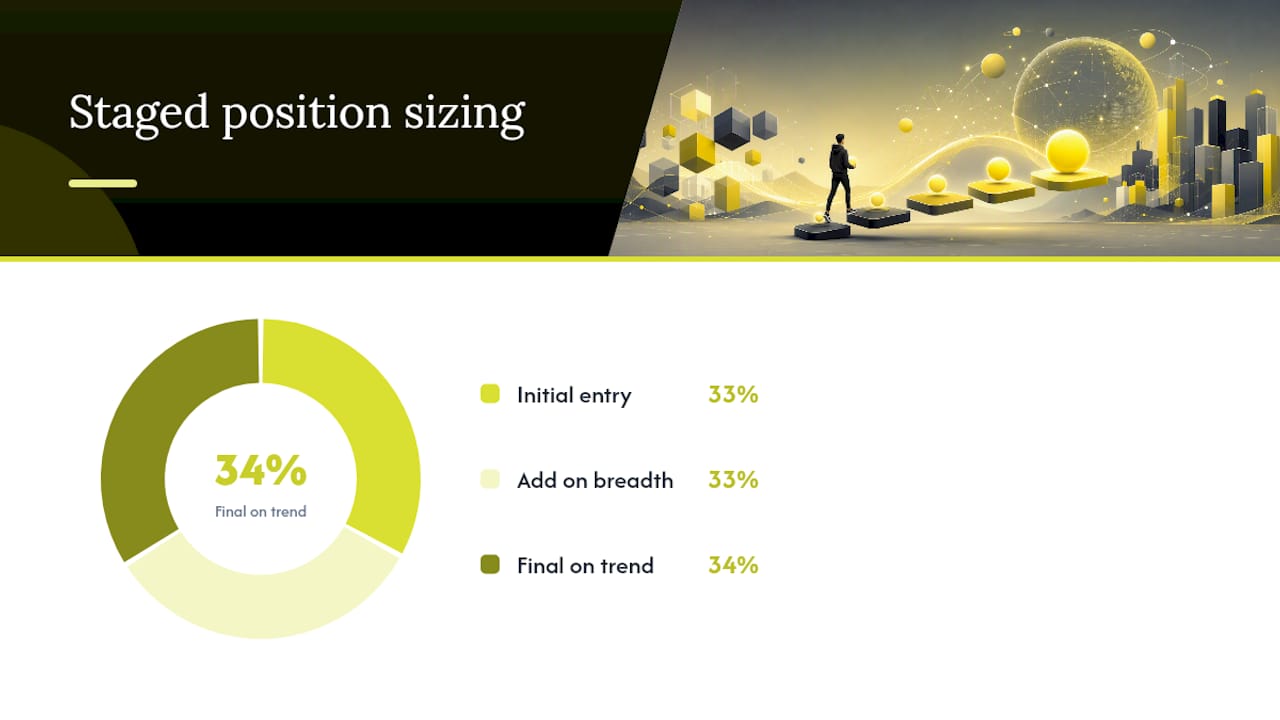
Staged entries beat all-in bets once an index confirms a rotation. Deploying a third of your intended position on initial confirmation, another third if breadth keeps improving, and the rest only if the trend holds across multiple sessions keeps you from getting fully exposed to a false signal.
On the way out, trimming into strength works better than trying to call a top. Selling a portion once a position doubles, then trailing a stop-loss under a key support level, locks in gains without forcing you to exit everything at once.
Traders and longer-term investors need different playbooks:
- Active traders lean on shorter windows and tighter stops, since alt rallies can reverse fast.
- Longer-term investors weight more toward the 90 day index and broader breadth measures, reducing noise from short-term spikes.
The most common mistakes are chasing a coin after it’s already up 40% in a day, using excessive leverage on low-liquidity alts, and ignoring slippage on thin order books, all of which turn a good call into a costly one.
What Are the Limits of Altcoin Season Indexes?
An index score is a rearview mirror, not a windshield. It reports what has already happened over the past 30 or 90 days and carries no built-in forecast of what happens next, a point the Altcoin Season Index methodology makes explicit.
Window and universe choices also shift the outcome. A top-50 universe on a 30 day window can flip regimes faster than a top-100 universe on a 90 day window, sometimes disagreeing entirely during choppy stretches.
Ignore or heavily discount the index when:
- Trading volume across the sample is unusually thin.
- A single narrow sector (one narrative, a handful of tokens) is driving the whole score.
- Techgaged’s coverage of how Bitcoin dominance spikes have previously cancelled apparent altseasons is a useful gut check before trusting a single reading.
Key Takeaways
Altcoin season is confirmed only when index breadth, falling Bitcoin dominance, and rising volume align, and even then the reading describes the past, not the future.
| Point | Details |
|---|---|
| Index threshold | A score of 75+ across the top 50 or 100 coins over 30 or 90 days signals altseason. |
| Exclusions matter | Stablecoins and wrapped or staked tokens are stripped out to avoid skewing the count. |
| Confirm with multiple signals | Pair the index with falling BTC dominance, rising ETH/BTC, and strong volume before acting. |
| Duration is unpredictable | Acute altseason phases have historically run from a few weeks to a few months. |
| Index is retrospective | Scores reflect past relative performance, not a forecast of what comes next. |
Where to Track Altcoin Season Data
Check live index scores daily on BlockchainCenter’s Altcoin Season Index or the Algosys Terminal altseason indicator for a second window comparison. For history and context, Techgaged’s coverage of past Bitcoin indicator patterns and historical timing data helps validate what a current reading actually means, and Techgaged’s broader crypto news coverage tracks the Bitcoin dominance and volume shifts that tend to move the index day to day.
Sources
- What really drives altcoin seasons? A closer look — TradingView (Cointelegraph)
- What is the Altcoin Season Index? — Gate Learn
- Altcoin Season Index: Is it Altseason right now? — BlockchainCenter
- Altseason Index — Algosys Terminal
FAQ
Is Altcoin Season Coming?
There’s no guaranteed timeline, but the setup to watch is a Bitcoin rally followed by consolidation alongside falling BTC dominance. Check a live Altcoin Season Index reading and BTC.D trend rather than relying on predictions.
Will Altseason Happen in 2026?
Nobody can say for certain, since the index only measures what has already happened, not what’s coming. Watching for the classic triggers, a Bitcoin rally and consolidation phase paired with improving altcoin breadth, is the most reliable way to catch it early if it does occur.
What Is Altcoin Season?
It’s a market phase where capital rotates out of Bitcoin into altcoins, producing broad gains across smaller-cap tokens rather than isolated pumps. It’s typically confirmed when 75% or more of the top 50 or 100 altcoins outperform Bitcoin over a trailing 30 or 90 day window.
Is It Altseason Right Now?
Check a live index reading against the 75 threshold, along with the BTC.D trend and whether ETH/BTC is climbing, to answer this on any given day. A single high reading without supporting volume or breadth is a weaker signal than one backed by all three.
Recommended
How do you rate this article?
Join our Socials
Briefly, clearly and without noise – get the most important crypto news and market insights first.
Most Read Today
1
MiCA Regulation: What EU Crypto Businesses Must Do Now
2Bitcoin’s Next Big Test Emerges As $5B In IBIT Options Near Expiry
3Chainlink Scores A Major Win As Coinbase Expands Tokenized Stocks
4Avalanche Records Strongest Tokenized Stock Growth In 24 Hours
5Bitwise’s SOL Buying Spree Nears A Major $1B Milestone
Latest




8
Also read
Similar stories you might like.
Crypto News
Bitcoin’s Next Big Test Emerges As $5B In IBIT Options Near Expiry
Azeez | 2026-08-26
Crypto News
Bitwise’s SOL Buying Spree Nears A Major $1B Milestone
Azeez | 2026-08-26

Crypto News
Chainlink Scores A Major Win As Coinbase Expands Tokenized Stocks
Azeez | 2026-08-26
Crypto News
Avalanche Records Strongest Tokenized Stock Growth In 24 Hours
Azeez | 2026-08-26

Crypto Guides
MiCA Regulation: What EU Crypto Businesses Must Do Now
Rokas | 2026-08-26
Crypto News
U.S. Treasuries Go On-Chain as Franklin Templeton Expands Into Asia
Azeez | 2026-08-25
Crypto News
Solana Validators Are Voting to Slow New SOL Creation and Raise Daily Burns
Azeez | 2026-08-25
Crypto News
The ETH/BTC Ratio Has Printed A Golden Cross For The First Time In 14 Months
Azeez | 2026-08-25

Crypto News
More Than Half Of BlackRock’s Recent Bitcoin Buying Came In One Week
Azeez | 2026-08-25
Crypto Guides
Impermanent Loss Explained: Risks, Math, and Fixes
Rokas | 2026-08-25