


Bitcoin coin on laptop keyboard. Source: TechGaged / Shutterstock
Bitcoin Inflows Spike as $75K Caps Rally
In Brief
- • Bitcoin outflows signal ongoing long-term accumulation.
- • Inflows spiked near $75K, suggesting whale selling pressure.
- • BTC faces resistance as mixed signals build volatility.

Bitcoin (BTC) is showing signs of sustained accumulation as coins continue leaving exchanges, pointing to longer-term holding behavior. At the same time, a sudden spike in inflows near $75,000 suggests large holders may be preparing to sell into strength. The mixed signals leave BTC at a critical point as it tests key resistance levels.
Outflows build long-term accumulation trend
On-chain data shows Bitcoin has been steadily leaving centralized exchanges for nearly two months. According to CryptoQuant analyst Darkfost, the monthly average netflow turned negative in March and currently sits around -1,640 BTC.
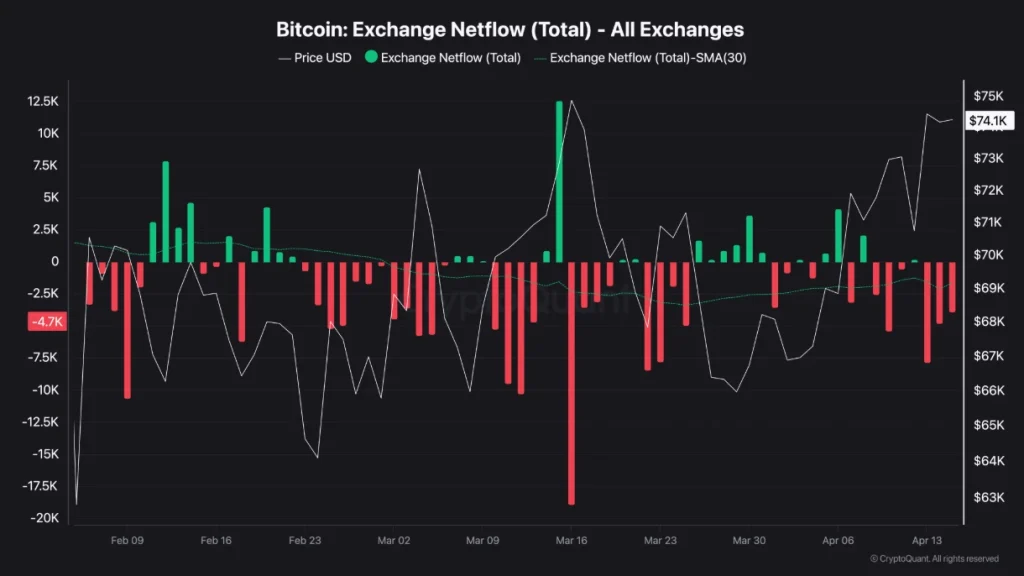
That shift suggests a structural trend rather than random movement. When Bitcoin leaves exchanges at this scale, it typically indicates investors are moving assets into cold storage with no immediate intention to sell.
Latest Stories
FTX Accuses Justin Sun of Sweeping $10M in Bitcoin from Poloniex

Aave DAO Weighs Proposal for App Integrating Fiat, Self-Custody Lending

MicroStrategy Gains New Institutional Backing from Verus Capital Partners
The consistency stands out. Many days have recorded only outflows, reinforcing the idea that accumulation is happening quietly in the background. This aligns with broader market behavior where long-term holders absorb supply during consolidation phases, often forming a base before larger moves.
Inflows spike as whales position near resistance
The picture changed as Bitcoin approached the $75,000 level. CryptoQuant reported exchange inflows surged to around 11,000 BTC per hour, the highest since December 2025.
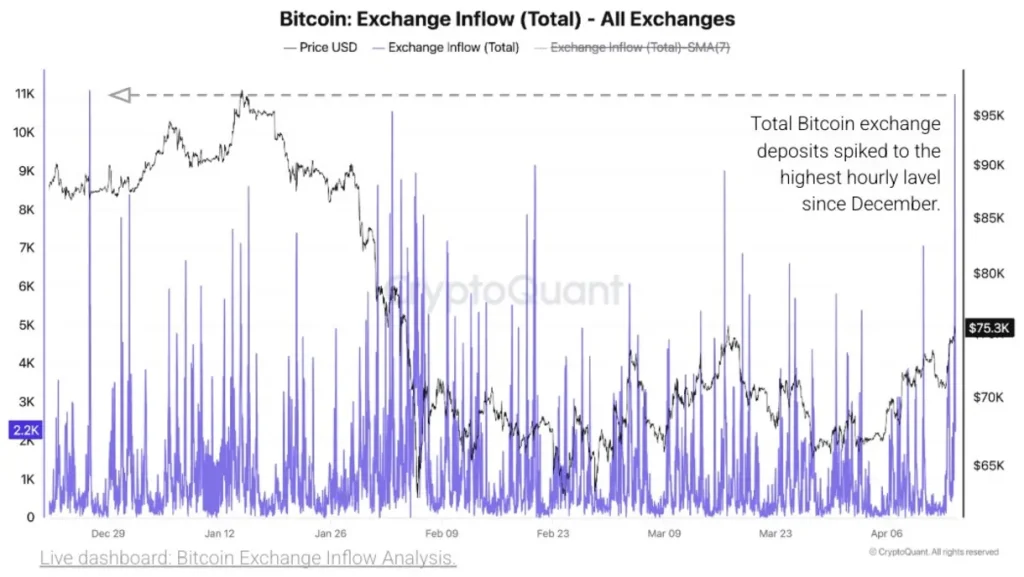
At the same time, the average deposit size jumped to 2.25 BTC, a level not seen since mid-2024. Large transfers exceeding 1,000 BTC, particularly to Binance, suggest whales were behind the move rather than retail participants.
Historically, this kind of inflow pattern has preceded periods of selling pressure. It indicates large holders may be positioning to distribute into market strength.
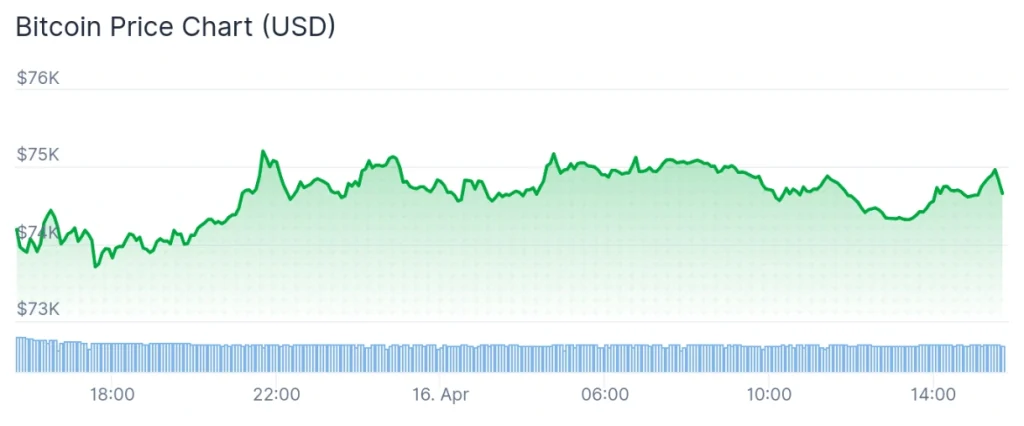
From a price perspective, Bitcoin briefly pushed above $75,000 but failed to hold the level. It remains within a multi-week range, with resistance forming between $75,000 and $78,100, the latter marked by Glassnode’s “True Market Mean.”
At the time of writing on April 16, BTC was changing hands at the price of $73,617.63, up 0.6% in the last 24 hours, advancing 4.9% across the past seven days, and accumulating an increase of 1.3% over the month, according to the most recent chart information.
Short term, the setup looks conflicted. Accumulation continues underneath, but whale-driven inflows signal potential downside volatility before any sustained breakout.
How do you rate this article?
Subscribe to our YouTube channel for crypto market insights and educational videos.


Join our Socials
Briefly, clearly and without noise – get the most important crypto news and market insights first.

Most Read Today
1
FTX Accuses Justin Sun of Sweeping $10M in Bitcoin from Poloniex
2Inverse Cramer Strategy Explained: The Cost of Overconfidence
3Clarity Act 2026: Everything You Should Know
4Bitcoin’s Calm May Be Hiding a Sharp Volatility Break
5Schwab Launches Retail Crypto Accounts With Bitcoin And Ethereum
Latest


8
Also read
Similar stories you might like.

Regulation
FTX Accuses Justin Sun of Sweeping $10M in Bitcoin from Poloniex
TechGaged | 2026-07-15
Market
MicroStrategy Gains New Institutional Backing from Verus Capital Partners
TechGaged | 2026-07-10

Blockchain
Bitcoin Core v30.3 Released, Improving Foundation: What to Know
TechGaged | 2026-07-10

Market
Bitwise Files Amended S-1 for Spot NEAR ETF, Eyes Approval
TechGaged | 2026-07-02

Regulation
US Forfeiture Targets 41 Bitcoin in Legal Action
TechGaged | 2026-07-02

Blockchain
Long-Term Bitcoin Holders Accumulate, Signaling Potential Bottom
TechGaged | 2026-07-01

Regulation
US Government Moves to Seize 16 Bitcoins from Kraken Account
TechGaged | 2026-07-01

Blockchain
Bitcoin Whale Moves $22.5M BTC, Signals Potential Market Shift
TechGaged | 2026-07-01

Crypto News
Ripple CEO Criticizes Strategy’s Bitcoin Model, Stays Bullish On BTC
TechGaged | 2026-06-30

Crypto News
BlackRock Has Sold ETH for 7 Straight Days — Is Institutional Sentiment Changing?
Azeez | 2026-06-30