


A holographic Solana logo glowing with rainbow streaks against a vivid purple alien landscape. Source: TechGaged / Shutterstock.
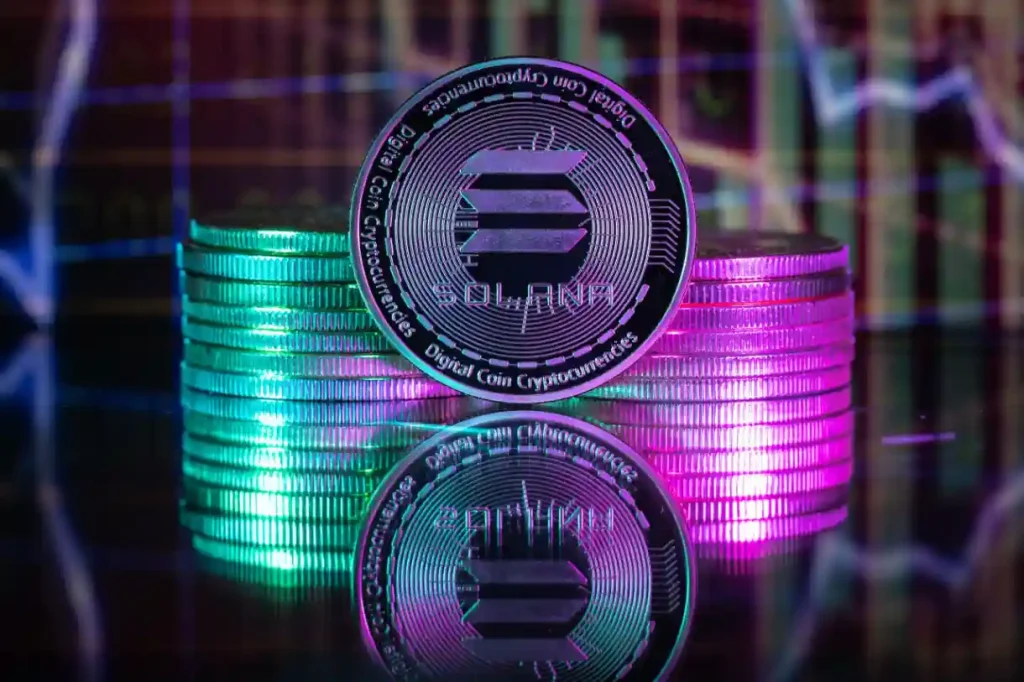
Goldman Sachs Holds $108M SOL Across Six ETFs, Strengthening Institutional Case for Solana
In Brief
- • Goldman Sachs holds $108M in Solana ETFs, signaling strong institutional conviction.
- • Early technical signs suggest a potential bottom, though confirmation is pending.
- • Institutional optimism is rising, but Solana still lags Bitcoin in performance.

Wall Street doesn’t make $108 million bets out of curiosity. When Goldman Sachs quietly disclosed a Solana ETF position spanning six products as of April 2026, it wasn’t a trade — it was a thesis statement.
And the market is still deciding what to do with it.
The Goldman Position: What It Actually Looks Like
The allocation isn’t parked in a single fund. Approximately $45 million sits in the Bitwise Solana Staking ETF and $35.7 million in the Grayscale Solana Trust ETF, with smaller positions spread across Fidelity, VanEck, 21Shares, and Franklin Templeton.
Diversification across six providers signals conviction in the asset, not just one fund manager.
Notably, two of those ETFs — BSOL and GSOL — stake their holdings and pass rewards back to investors, making this a yield-generating position rather than a simple price bet.
Goldman’s move didn’t arrive in isolation. Total Solana ETF AUM has crossed $1 billion, Morgan Stanley filed additional S-1s in early 2026, and BlackRock’s BUIDL fund crossed $550 million deployed on the Solana network.
The institutional queue is still expanding — Goldman was not first, but it is the most watched.
Do the Charts Know Something the Market Hasn’t Priced In Yet?
The technical picture is where the story gets complicated.
On the SOL/USD weekly chart (captured: April 26, 2026 — 14:23 UTC), Solana is trading at $86.44 — well below the middle Bollinger Band at $101.27 and deep beneath the upper band at $145.17.
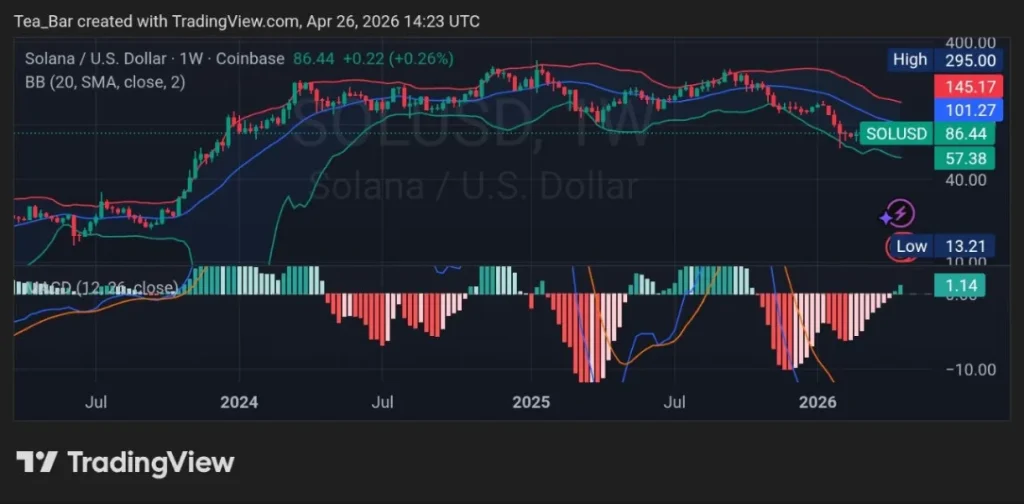
The high of $295 visible on the chart illustrates the sheer scale of the drawdown from the 2025 peak.
However, the MACD is printing at 1.14 — a thin but meaningful green reading that marks the first positive histogram bar after months of deeply negative territory.
The MACD lines themselves remain below zero, so this is an early signal, not a confirmed reversal.
But in the context of Goldman’s entry at the $85–86 level, institutional and technical floors appear to be forming in the same zone simultaneously.
The SOL/BTC weekly chart tells a more cautious story. SOL is priced at 0.0011064 BTC, sitting between the lower Bollinger Band (0.0010569) and the middle band (0.0013017) — meaning SOL continues to underperform Bitcoin meaningfully.
The MACD here reads -0.0000086 against a signal of -0.0001068, and while the gap between those two lines is narrowing — a classic sign of decelerating bearish momentum — it has not crossed into positive territory.
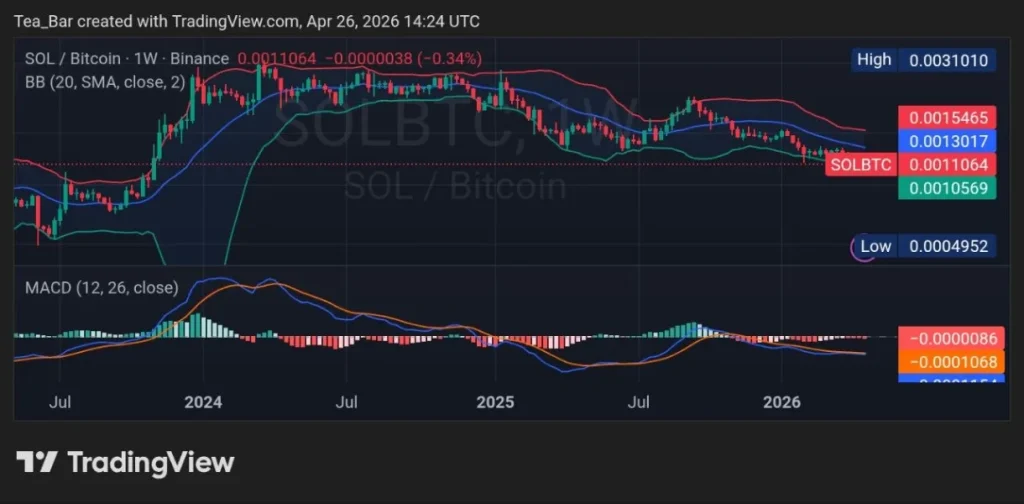
SOL/BTC has not yet confirmed a recovery against Bitcoin. For a full dollar-denominated breakout to materialise, that cross needs to follow.
The Institutional Thesis vs. The Chart Reality
Goldman’s position reflects a multi-quarter thesis built around regulatory clarity, staking yield, and Solana’s dominance in on-chain activity — not a short-term trade.
Standard Chartered holds a 2026 price target of $250 for SOL, and Changelly’s range of $140–$250 aligns with a full Bollinger Band reclaim on the weekly.
The charts suggest the foundation may be forming. The institutions suggest the conviction is already there.
The question the market hasn’t answered yet: is the gap between where Goldman bought and where the charts confirm — the opportunity, or the warning?
Disclaimer:
This article is for informational purposes only and does not constitute financial, investment, or trading advice. The views expressed are based on publicly available data, market observations, and the author’s interpretation at the time of writing. Cryptocurrency markets are highly volatile and unpredictable, and past performance or current technical setups do not guarantee future results. Readers should conduct their own research and consult with a qualified financial advisor before making any investment decisions. TechGaged does not accept liability for any losses incurred based on the information presented.
How do you rate this article?
Subscribe to our YouTube channel for crypto market insights and educational videos.


Join our Socials
Briefly, clearly and without noise – get the most important crypto news and market insights first.
Most Read Today
1
The Man Who May Have Built Bitcoin Has Bet It Hits $500K–$1M by 2028
2Solana DEX Dominance Continues to Outpace Ethereum — But the Full Story Is More Complicated
3Strategy’s $2.54B Bitcoin Bet Signals a Potential Market Shift
4April’s Crypto Hack Crisis: $606M Drained in Just 18 Days
5Dogecoin’s Path to $0.50 in 2026: What Would Actually Need to Happen
Latest


8
Also read
Similar stories you might like.
Altcoins
Solana’s Major Banking Boost — Here’s Why It Matters
Azeez | 2026-04-18

Altcoins
Glamsterdam Upgrade: Can a 100K TPS Breakthrough Push ETH Back to $4,000?
Azeez | 2026-04-18
Bitcoin
The Oil Cliff of April 19 Could Affect Bitcoin Again
Azeez | 2026-04-18
Bitcoin
951 BTC Move Sparks Questions: Is Tether Quietly Accumulating Bitcoin?
Azeez | 2026-04-16
Altcoins
Analyzing Bitwise’s $11M BSOL Surge—Are Institutions Front-Running a Retail Breakout?
Azeez | 2026-04-17
Altcoins
April 12 Token Unlock: What it Could Mean for Aptos Price
Azeez | 2026-04-17
Altcoins
3 Cryptocurrencies to Avoid in April
Azeez | 2026-04-17
Altcoins
Solana Price Outlook as SOL Hits 167M Users in April
Azeez | 2026-04-17
Altcoins
Will BNB Chain’s Annual Percentage Yield Surge Push Prices Higher or Be a Trap?
Azeez | 2026-04-17
Altcoins
Unleashing STRIDE: Could It Spark Thrilling Gains for Solana?
Azeez | 2026-04-17