


XRP Could Snap 16% in Sudden Breakout
XRP Could Snap 16% in Sudden Breakout
In Brief
- • XRP is tightening inside a symmetrical triangle.
- • A breakout is nearing as volatility builds.
- • The pattern suggests a ~16% move once it breaks.

XRP is entering one of the most tense technical setups it has seen in weeks, tightening inside a symmetrical triangle that traders typically associate with sharp, directional moves.
After days of choppy, indecisive price action, the chart is compressing so tightly that even small pushes now carry outsized impact, which is a classic sign that volatility is about to return.
Indeed, XRP’s current structure has historically preceded swings of around 16%, according to the analysis of pattern-driven setups shared by renowned cryptocurrency trading specialist Ali Martinez in an X post on December 10.
His expectation aligns with what the chart itself shows. This includes each bounce getting narrower, every reaction more compressed, and price pulling toward an apex where a break becomes almost inevitable.
Volatility Builds as XRP Nears Decision Point
The structure is forming on the 4-hour timeframe, where the token continues to oscillate between a rising support trendline and a descending resistance trendline. The dotted projection on the analyst’s chart illustrates how XRP may continue to ping-pong between these lines for a few more sessions before finally forcing a breakout.
Currently, XRP is trading at $2.07, up 0.72% on the day, down 5.04% across the week, and accumulating a loss of 16.71% in the past month, according to the most recent price chart information.

This setup is notable because of the way sentiment often flips once volatility returns. A bullish break above resistance could trigger momentum buying and short liquidations, sending the price sharply higher. Meanwhile, a bearish break risks washing the token back toward lower support levels that bulls have repeatedly fought to defend.
High-Tension Pattern With a Short Fuse
Triangle patterns do not reveal direction ahead of time, but they do show compression and the probability of expansion. That is why traders across social media are watching this one closely.
XRP sits near the midpoint of the formation, still undecided, and continues to build pressure. Once the price closes decisively beyond one of the triangle’s boundaries, the next phase begins.
According to the analysis, the measured target sits roughly 16% away from the breakout point. In a market already primed for movement, that shift could set the tone for how XRP trades into mid-December.
More Must-Reads:
How do you rate this article?
Subscribe to our YouTube channel for crypto market insights and educational videos.


Join our Socials
Briefly, clearly and without noise – get the most important crypto news and market insights first.


8
Also read
Similar stories you might like.

Altcoins
Rakuten Makes XRP Spendable for Millions — Why Is That Both Exciting and a Warning?
Azeez | 2026-04-30

Bitcoin
Tether Plots Bitcoin Empire, Backs Mega Merger – What Users Gain From Deal
Sead | 2026-04-30
Altcoins
Ripple Doubles Down On Dubai – What Investors Should Know
Sead | 2026-04-30

Altcoins
Why This Phase of Crypto Feels Different
Azeez | 2026-04-29

Altcoins
Bitcoin Holds $77K Ahead of FOMC as Altcoins Turn Green
Ana | 2026-04-29

Beginners
How Accurate Are Financial Experts?
Sead | 2026-04-29

Altcoins
Judge Rejects Sam Bankman-Fried’s New Trial Request
Ana | 2026-04-29
Bitcoin
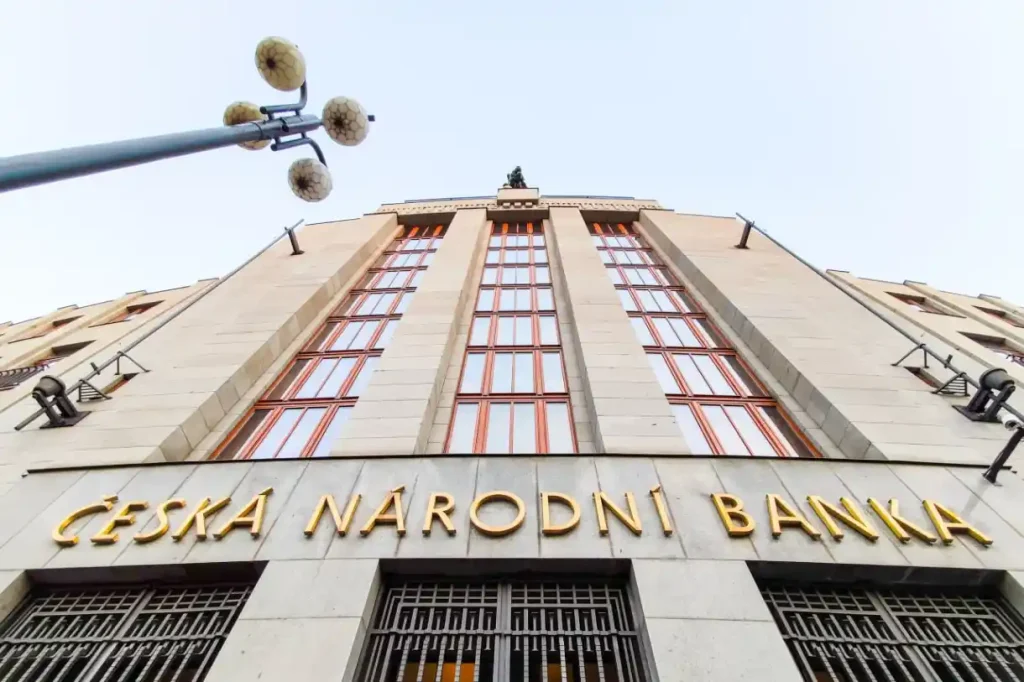
Czech Central Bank Explores Bitcoin as Reserve Asset
Ana | 2026-04-29

Altcoins
U.S. Cracks Down on Iran’s Crypto and Oil Revenues
Rokas | 2026-04-29

Altcoins
CME Futures Coming May 4 – Avalanche (AVAX) About to Explode or Implode?
Azeez | 2026-04-29