


XRP coin over trading chart. Source: TechGaged / Shutterstock
XRP Triangle Pattern Points To Major Upside Target
In Brief
- • XRP is forming a multi-year symmetrical triangle pattern.
- • A breakout above $3.32 could trigger a major rally.
- • Analyst projects a potential long-term target up to $48

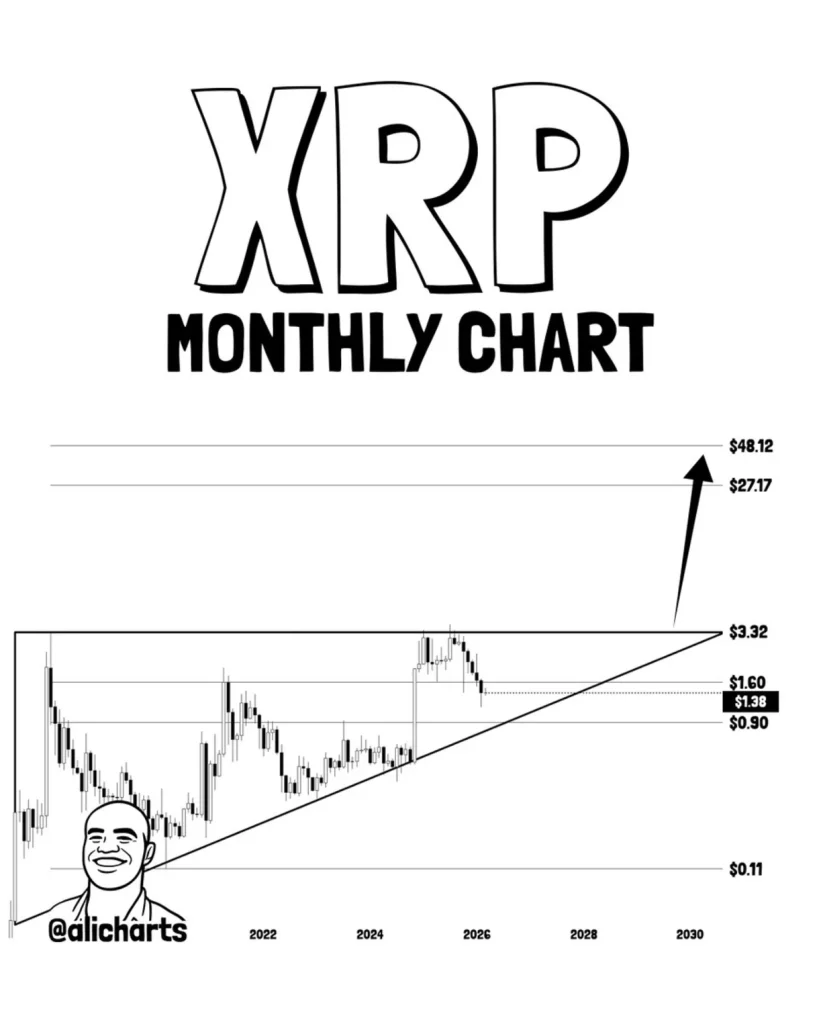
A multi-year triangle pattern is forming on XRP’s monthly chart, signaling a potential major breakout during the next cryptocurrency bull cycle. The structure shows price compressing between rising support and falling resistance over several years. According to one analyst, a breakout from the pattern could point to a significant upside target.
Multi-year XRP triangle pattern
In an X post on March 13, popular crypto trading expert Ali Martinez shared a chart showing XRP forming a large symmetrical triangle that has been developing for several years.
Triangle patterns occur when price compresses between rising support and falling resistance, gradually forming a wedge-shaped structure. In technical analysis, such formations often signal a large directional move once the price eventually breaks out of the pattern.
The analyst suggests that if XRP breaks the upper boundary of the triangle, the structure could point to a long-term price target near $48.
Key levels on the chart
The chart highlights several key price zones that could shape XRP’s trajectory. Near-term support levels appear around $0.90 and $1.60, while a critical resistance area sits near $3.32.
According to the analysis, a sustained move above that resistance level could trigger the next major expansion phase for XRP. The projection arrow on the chart extends toward the $27-$48 range, suggesting the possible upside if a full breakout occurs during the next bull cycle.
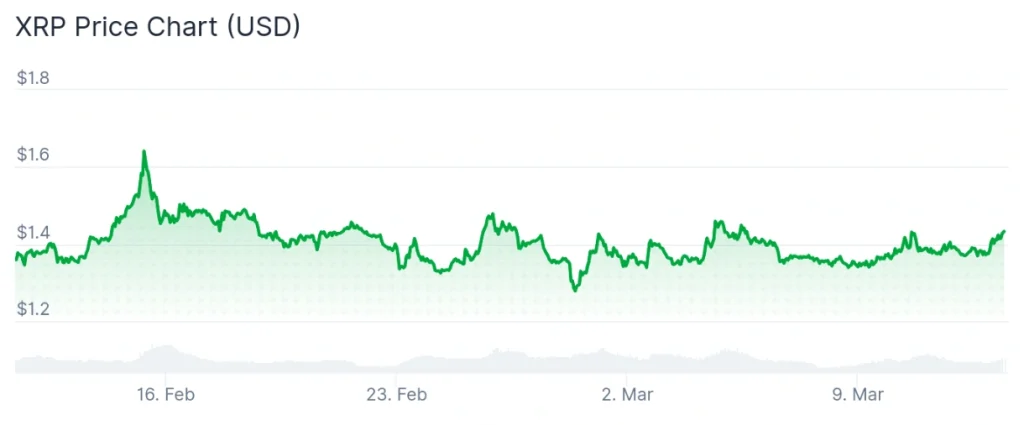
For the time being, the price of XRP stands at $1.43, which represents a 3.7% gain on the day, an increase of 1.9% across the week, and an accumulated advance of 4.7% over the past month, per the most recent chart data.
Long-term bull run scenario
Martinez has previously highlighted triangle formations as signals of potential large-scale moves in crypto markets. A successful breakout typically requires strong buying pressure and increased market participation.
Though the chart presents an optimistic scenario, analysts generally note that technical projections depend heavily on broader market conditions and investor demand.
For now, the multi-year triangle remains intact, with traders watching whether XRP eventually pushes through the key resistance zone that could trigger the next major rally.
More Must-Reads:
How do you rate this article?
Subscribe to our YouTube channel for crypto market insights and educational videos.


Join our Socials
Briefly, clearly and without noise – get the most important crypto news and market insights first.


8
Also read
Similar stories you might like.

Altcoins
Why This Phase of Crypto Feels Different
Azeez | 2026-04-29

Altcoins
Bitcoin Holds $77K Ahead of FOMC as Altcoins Turn Green
Ana | 2026-04-29

Beginners
How Accurate Are Financial Experts?
Sead | 2026-04-29

Altcoins
Judge Rejects Sam Bankman-Fried’s New Trial Request
Ana | 2026-04-29

Bitcoin
Czech Central Bank Explores Bitcoin as Reserve Asset
Ana | 2026-04-29

Altcoins
U.S. Cracks Down on Iran’s Crypto and Oil Revenues
Rokas | 2026-04-29

Altcoins
CME Futures Coming May 4 – Avalanche (AVAX) About to Explode or Implode?
Azeez | 2026-04-29

Altcoins
Ripple CEO Says XRP Remains Company’s “North Star”
Rokas | 2026-04-29

Altcoins
Bitcoin Fails at $79.5K, Triggers Market Pullback
Ana | 2026-04-28

Altcoins
The Consensus Countdown Has Started — Here’s What Miami’s Monster Week Means for Crypto
Azeez | 2026-04-28