


Bitcoin logo on phone with price chart behind. Source: TechGaged / Shutterstock
Bitcoin Overlay With Nikkei Points To Multi-Year Rally
In Brief
- • Chart links Bitcoin cycles with Japan’s Nikkei index.
- • Model suggests the bull cycle could last until 2028–2029.
- • Analysis points to several years of potential upside.

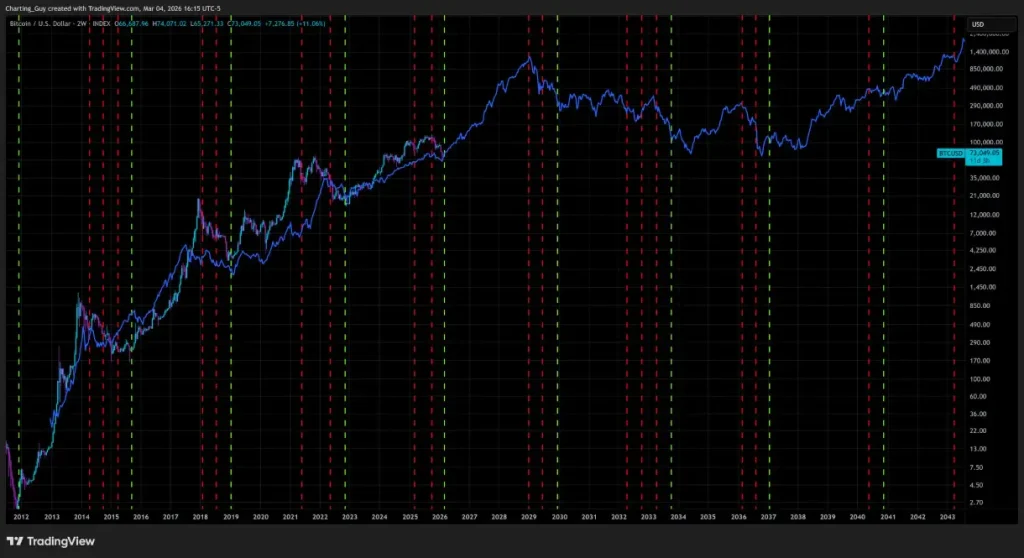
A long-term Bitcoin (BTC) chart comparing it with Japan’s Nikkei 225 index suggests the current market cycle may still have several years of upside remaining. The analysis highlights a historical correlation between Bitcoin’s price movements and the Japanese stock index. The model points to a potential bullish window lasting until late 2028 or early 2029.
Bitcoin And Nikkei Correlation
The chart, shared by cryptocurrency market commentator ChartingGuy in an X post on March 4, overlays Bitcoin’s long-term price trend with the Nikkei 225, Japan’s primary stock market index.
According to the analyst, the two assets have shown a surprisingly consistent relationship over time. Major highs and lows in Bitcoin appear to align closely with turning points in the Nikkei index.
By examining these overlapping trends, the analyst argues that Bitcoin may still be operating within the same long-term macro cycle that began after the global financial crisis of 2008-2009. Bitcoin itself launched shortly after that period, emerging alongside the recovery phase in global financial markets.
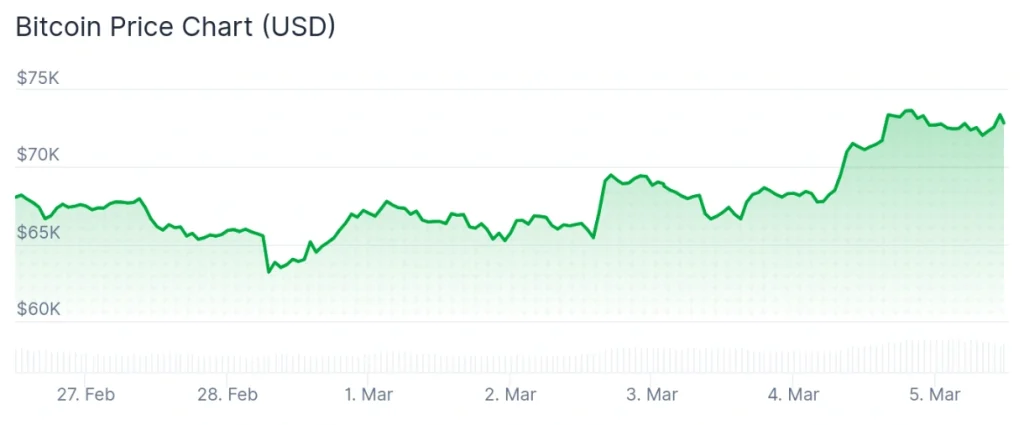
For the time being, Bitcoin is trading at $72,831.62, signaling a 2.5% advance on the day and a 6.7% recovery across the week, reducing to 6.7% the declines accumulated over the past month, per the most recent chart information.
Lunar Cycles And Market Timing
The analysis also incorporates lunar cycle timing as an additional indicator. According to the model, a potential pivot point could occur around the March total lunar eclipse, which may mark a transition into a stronger upward phase for Bitcoin.
If the historical pattern continues to hold, the chart suggests the broader bull market could extend through late 2028 or early 2029 before the long-term cycle begins to fade.
Several other cyclical factors also align with that timeframe. The period includes another U.S. presidential election cycle, the next Shmita year, and the 100-year anniversary of the 1929 stock market crash. In the analyst’s words:
“This timing aligns with the start of a new lunar cycle, the next Shmita year (a 7-year cycle; the last one triggered the 2022 crash), the next presidential election/inauguration, and it’s the 100-year anniversary of the 1929 stock market crash, the most severe in history.”
The analyst describes the model as a framework for understanding market timing rather than a precise price prediction.
Under that interpretation, the next two to three years could represent the most bullish phase of the current market cycle before a longer-term bear market eventually emerges.
More Must-Reads:
How do you rate this article?
Subscribe to our YouTube channel for crypto market insights and educational videos.


Join our Socials
Briefly, clearly and without noise – get the most important crypto news and market insights first.


8
Also read
Similar stories you might like.

Altcoins
Arbitrum Freezes $71M ETH Linked To Kelp Hack
Rokas | 2026-04-21

Beginners
Inverse Cramer Strategy Explained: The Cost of Overconfidence
Sead | 2026-04-20
Altcoins
XRP Signals 35% Move As Bitcoin Struggles
Ana | 2026-04-20

Market
Is It a Good Time to Buy Crypto Right Now?
Sead | 2026-04-20

Bitcoin
Nakamoto Inc. Moves Toward Public Offering With SEC Filling
Ana | 2026-04-20

Altcoins
Kelp DAO’s $293M Loss — A Wake-Up Call for LayerZero Users
Azeez | 2026-04-20

Altcoins
Japan Bank Taps Ripple for 24/7 International Transfers
Ana | 2026-04-20

Bitcoin
Bitcoin Gets a New Rallying Cry From Tether CEO Paolo Ardoino
Ana | 2026-04-20

Altcoins
RaveDAO (RAVE) Plunges by 95%: Could Delistings Be the Next Major Blow?
Azeez | 2026-04-20

Bitcoin
Jon Stewart vs. Bitcoin Debate Takes Unexpected Turn
Rokas | 2026-04-20