


Technical indicators show Bitcoin at historically oversold levels, echoing COVID-era extremes.
Turning Point: Bitcoin Drops Into Rare Oversold Territory Last Seen During the COVID Crash
In Brief
- • Bitcoin’s long-term RSI has hit a rare oversold level.
- • The signal mirrors conditions last seen in March 2020.
- • Some traders see it as a potential accumulation zone.
Ad
Bitcoin (BTC) is flashing a technical signal that has appeared only once before in its history, during the March 2020 COVID market crash.
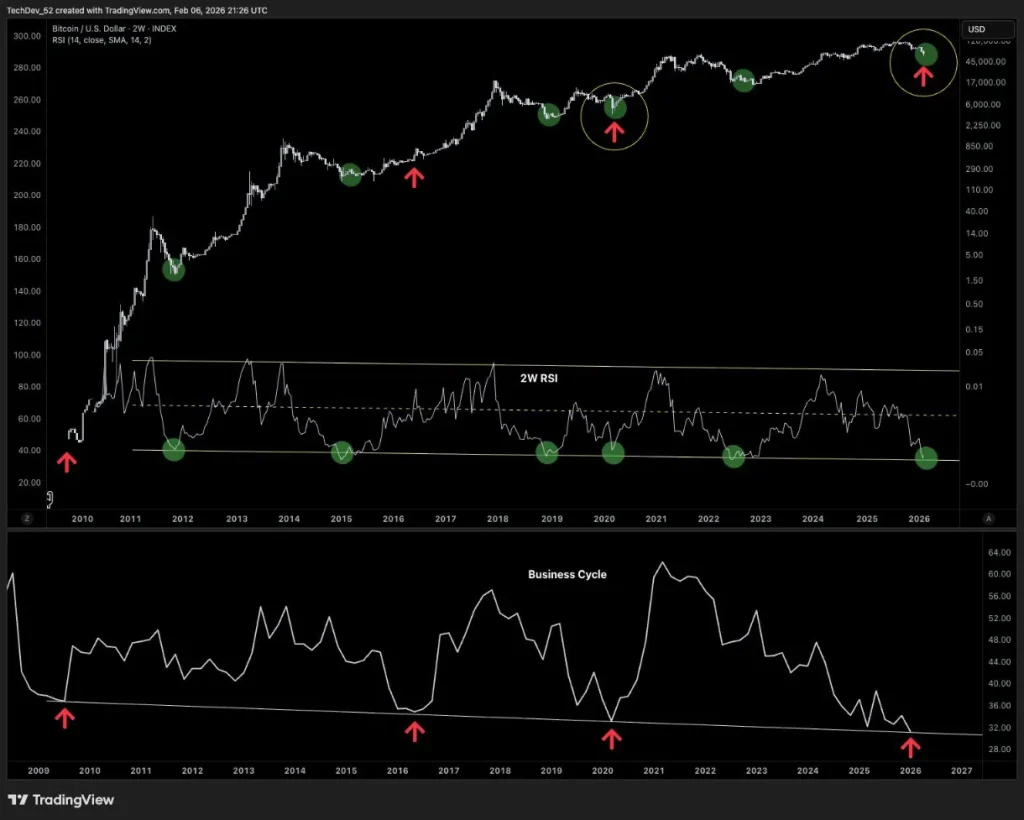
Indeed, cryptocurrency market analyst TechDev noted in an X post shared on February 11 that Bitcoin’s 2-week relative strength index (RSI) has reached levels previously seen only at the bottom of the COVID-induced crash.
At the same time, his broader business cycle indicator suggests the market is near the lower end of its macro cycle. According to his summary:
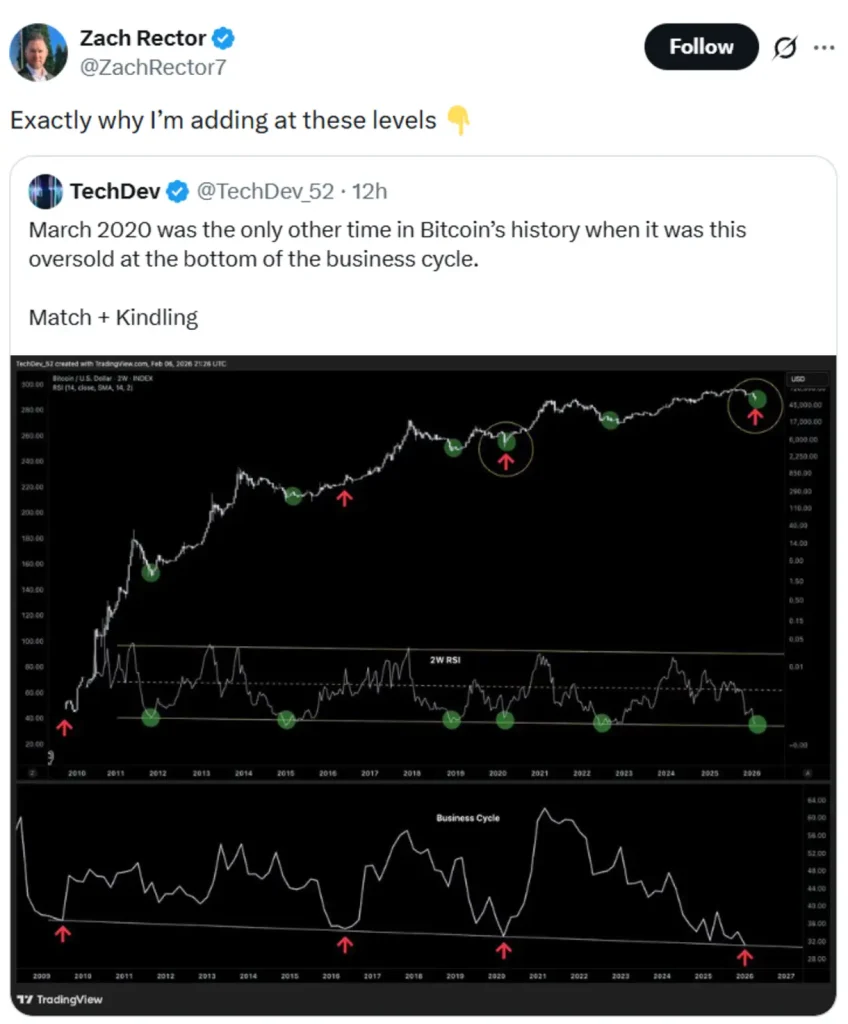
“March 2020 was the only other time in Bitcoin’s history when it was this oversold at the bottom of the business cycle.”
What the March 2020 Comparison Means
In March 2020, Bitcoin fell below $4,000 during the global liquidity shock. That period marked one of the most extreme oversold readings on long-term momentum indicators.
Following that signal, Bitcoin entered a multi-month recovery that ultimately led to new all-time highs (ATHs) in 2021.
The current setup, per the chart shared by TechDev, shows a 2-week RSI near historic lows, a business cycle indicator at long-term support, and price reacting at a macro trendline.
Though technical signals don’t guarantee outcomes, the rarity of this setup is what’s drawing attention.
Traders Say They’re Accumulating
The analysis quickly gained traction among market participants. Crypto industry commentator Zach Rector responded, stating:
“Exactly why I’m adding at these levels.”
That comment reflects a broader strategy some traders follow during extreme oversold conditions, in a gradual accumulation rather than attempting to time an exact bottom.
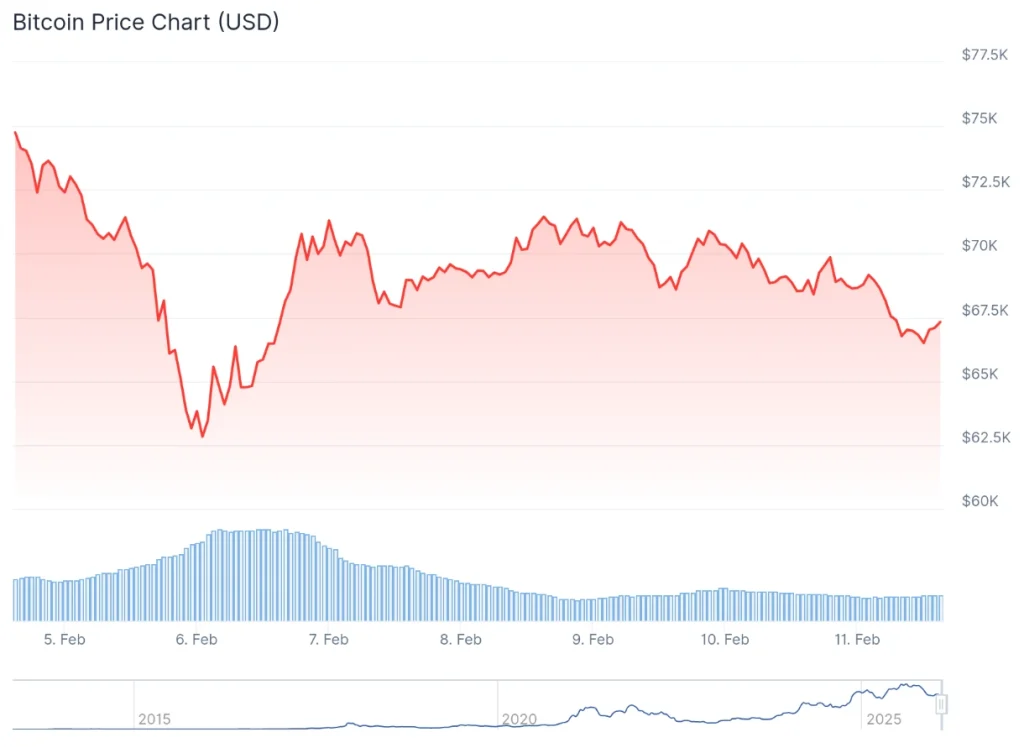
Currently, the price of Bitcoin stands at $67,350.36, which reflects a 2.3% decline on the day, a more significant drop of 9.9% over the past week, and a 25.5% loss accumulated across the month, per the latest chart information.
Why This Matters For Investors
Long-term RSI readings on higher timeframes (like the 2-week chart) are not short-term trading tools. They are typically used to identify macro inflection points.
Historically, similar signals have occurred near the 2015 cycle bottom, the 2018-2019 bear market lows, and the March 2020 crash. If the pattern holds, Bitcoin may be closer to macro support than exhaustion. However, confirmation typically requires reclaiming higher resistance levels.
For now, traders are watching whether this “match + kindling” setup turns into ignition or if further volatility lies ahead.
Bitcoin Price Today
More Must-Reads:
How do you rate this article?
Subscribe to our YouTube channel for crypto market insights and educational videos.


Join our Socials
Briefly, clearly and without noise – get the most important crypto news and market insights first.
Most Read Today
1
Sui Approaches 800K Users as Token Unlock Nears — Can Price Stay Resilient?
2Could SpaceX’s IPO Be the Catalyst That Sends Dogecoin Above $0.10?
3Mystery Deepens as $400M ‘Lost’ Bitcoin Suddenly Moves
4Bitcoin Miners Turn to AI as Profits Collapse
5TRON Moves Toward Institutions: How Anchorage Support Could Influence TRX Price
Latest


8
Also read
Similar stories you might like.

Industry
Trump Backs Bitcoin, Stablecoins In New Pro-Crypto Push
Ana | 2026-03-30

Industry
Canada Proposes Ban on Crypto Political Donations
Ana | 2026-03-30

Altcoins
Ethereum Foundation Makes Record ETH Staking Move
Ana | 2026-03-30
Bitcoin
Bitcoin Miners Turn to AI as Profits Collapse
Ana | 2026-03-30

Bitcoin
Mystery Deepens as $400M ‘Lost’ Bitcoin Suddenly Moves
Rokas | 2026-03-30

Altcoins
Kiyosaki Warns of Inflation Crisis, Lists 6 Safest Investments for 2026
Rokas | 2026-03-30

Altcoins
TRON Moves Toward Institutions: How Anchorage Support Could Influence TRX Price
Azeez | 2026-03-29
Altcoins
Gold Enters DeFi: Tether’s XAUt Expansion to BNB Chain Could Shift Market Dynamics
Azeez | 2026-03-29

Altcoins
Sui Approaches 800K Users as Token Unlock Nears — Can Price Stay Resilient?
Azeez | 2026-03-29

Altcoins
Could SpaceX’s IPO Be the Catalyst That Sends Dogecoin Above $0.10?
Azeez | 2026-03-29