


Cardano Flashes Major Buy Signal After Heavy Selling
Cardano Flashes Major Buy Signal After Heavy Selling
In Brief
- • Cardano’s TD Sequential just triggered a buy signal after weeks of decline.
- • Price action shows early signs of seller exhaustion and stabilization.
- • A break above $0.43–$0.45 would confirm a potential reversal.
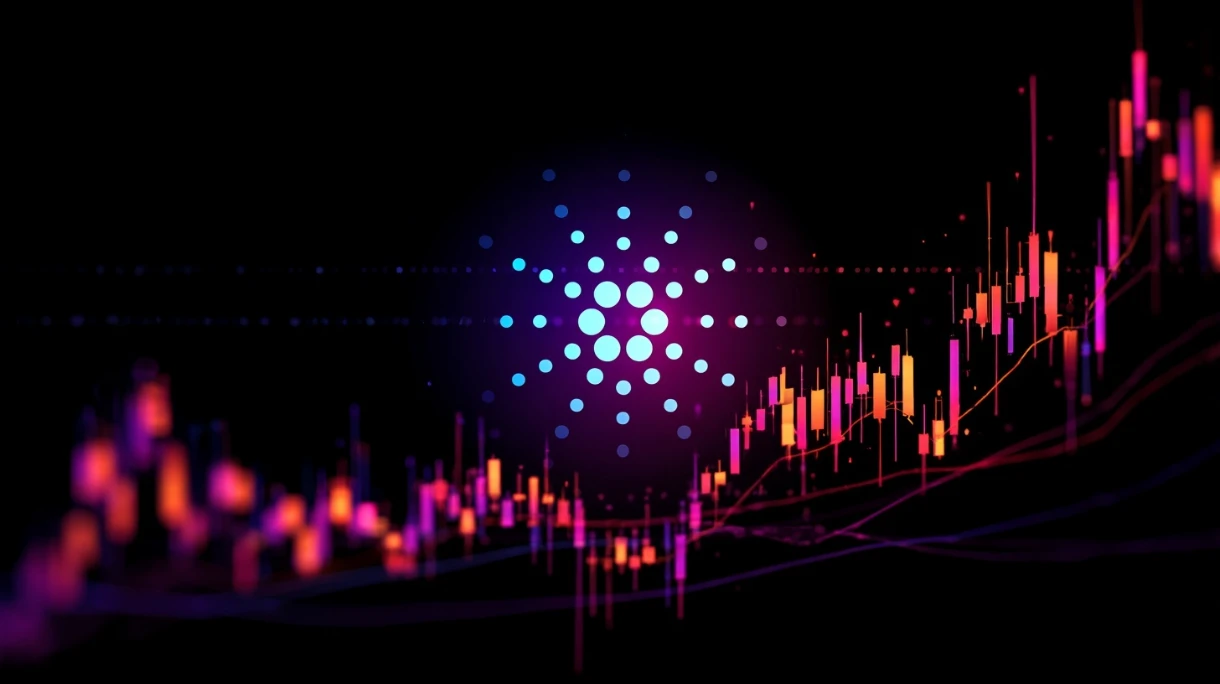
Cardano (ADA) may be nearing a meaningful shift in momentum. After weeks of steady decline, the TD Sequential indicator has just flashed a buy signal on ADA’s three-day chart.
Ad
The timing is notable, as ADA has been grinding lower since mid-November, carving out a staircase of black candles that pushed the price toward the lower end of its recent range. Now, after an extended downswing, the model is signaling that seller exhaustion may be setting in.
As it happens, the TD Sequential is best known for identifying trend exhaustion points on both sides of the market. A nine-count often precedes a pause or reversal in the prevailing direction, and ADA’s chart has now completed that sequence.
At the same time, Cardano has begun printing its first cluster of lighter candles, hinting that buyers are attempting to regain a foothold after a difficult stretch, according to the analysis shared by renowned cryptocurrency trading specialist Ali Martinez in an X post on December 1.
Ad
Classic Reversal Structure Forming Beneath the Surface
While the broader crypto market remains tightly correlated to Bitcoin (BTC)’s movements, ADA’s structure has taken on characteristics typically associated with mid-trend resets.
Long wicks on recent candles show that sellers pushed prices lower but failed to keep ADA pinned at the lows. The current candle is holding above the previous three-day close, suggesting early accumulation pressure as the market processes the TD signal.
Historically, ADA has responded to TD Sequential signals with measurable reversals, though not always immediately. Indicators like this do not guarantee direction, but they often coincide with periods where volatility compresses, sentiment turns cautious, and market makers begin positioning for a bounce.
In this case, the signal arrives just as ADA approaches a psychological zone that attracted buyers during earlier drawdowns.
At the moment, Cardano is trading at $0.3880, recording a decline of 7.37% on the day, having dropped 5.94% across the week, and accumulating a loss of 36.91% over the past month, according to the most recent price chart information.

Market participants will now be watching whether ADA can reclaim the upper $0.43 – $0.45 region, an area that previously acted as both support and resistance. A move through that band may confirm the strength of the TD setup, while failure to hold the current candle could delay any breakout attempt.
More Must-Reads:
How do you rate this article?
Subscribe to our YouTube channel for crypto market insights and educational videos.


Join our Socials
Briefly, clearly and without noise – get the most important crypto news and market insights first.
Most Read Today
1
Peter Schiff Warns of a U.S. Dollar Collapse Far Worse Than 2008
2Samsung crushes Apple with over 700 million more smartphones shipped in a decade
3Dubai Insurance Launches Crypto Wallet for Premium Payments & Claims
4XRP Whales Buy The Dip While Price Goes Nowhere
5Luxury Meets Hash Power: This $40K Watch Actually Mines Bitcoin
Latest


8
Also read
Similar stories you might like.

Bitcoin
Why Bitcoin Looks Weak Today But Strong Long-Term
Ana | 2026-01-29

Altcoins
Tom Lee’s Bitmine Deepens Massive Ethereum Staking Bet to $7.6B
Ana | 2026-01-29

Altcoins
Dogecoin Bulls vs. Bears? One Key Line Decides Everything
Ana | 2026-01-29

Altcoins
XRP Whales Buy The Dip While Price Goes Nowhere
Ana | 2026-01-29

Altcoins
Russia Finalizes Rules for Bitcoin, Ethereum, and Stablecoins
Ana | 2026-01-29
Altcoins
Crypto Mirrors 2020 as a 2021-Style Rally Looms
Ana | 2026-01-28
Bitcoin
Bitcoin’s Four-Year Cycle Is “Dead,” Claims the World’s Smartest Man
Ana | 2026-01-28
Altcoins
Grayscale Tweaks XRP Trust Filing as Spot ETF Momentum Heats Up
Ana | 2026-01-29

Bitcoin
Dorsey’s Offline Chat and Bitcoin App Surges Amid Iran, Uganda Shutdowns
Ana | 2026-01-29

Altcoins
Vitalik Warns Crypto’s Biggest Risk Isn’t Hackers – It’s Something Worse
Ana | 2026-01-28