


Bitcoin coin. Source: TechGaged / Shutterstock
Bitcoin Coiling Hard, Traders Brace For Move
In Brief
- • Bitcoin is compressing inside a descending intraday channel.
- • $67.4K is the key breakout resistance.
- • Volatility squeeze signals an imminent move.
Bitcoin is consolidating inside a descending intraday channel, with $67,400 emerging as the key resistance level. The structure has held across lower time frames as the price continues to grind sideways within narrowing boundaries. The setup points to a potential breakout decision zone as volatility compresses.
Indeed, prominent cryptocurrency trading expert Ali Martinez highlighted in an X post on February 19 that Bitcoin remains confined within a parallel channel, with repeated rejections near the upper boundary. Each bounce off the lower trendline has produced modest relief rallies, but bulls have struggled to push through the ceiling. That ceiling now sits clearly around the $67.4K level, which is shaping up as the trigger for the next directional move.
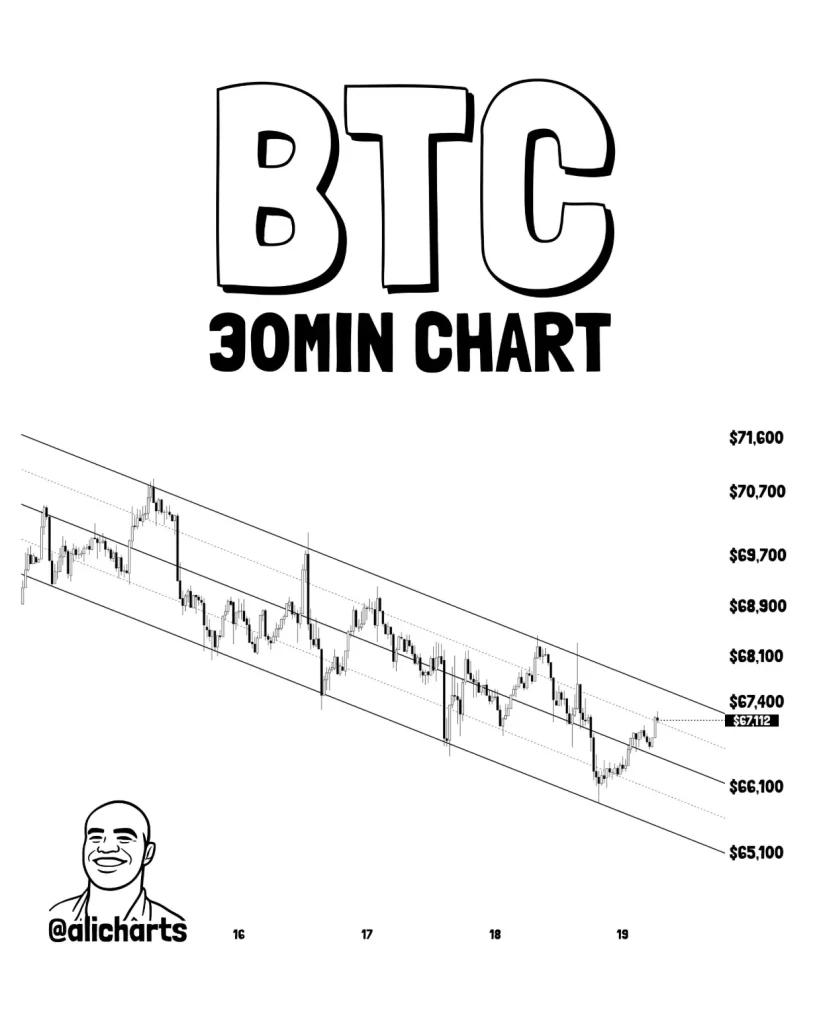
Compression Phase Raises Breakout Stakes
Consolidation inside channels often precedes expansion phases, especially when the price repeatedly respects both support and resistance. In this case, the pattern suggests a market waiting for a catalyst. The longer the price remains compressed, the more reactive the eventual breakout can become.
A confirmed push above $67,400 would likely invalidate the short-term down-channel structure and open the door for momentum-driven upside. Traders typically watch for strong candle closes and rising volume to validate such breakouts, as false moves are common during late consolidation phases.
On the flip side, failure to reclaim the upper boundary keeps Bitcoin vulnerable to continued sideways drift or another test of lower support zones within the channel. Repeated compressions like this often act as decision points where liquidity builds on both sides of the market.
For now, the structure remains neutral but fragile. Trading at $66,673.69, which is a decline of 1.2% on the day, 1.8% across the week, and 26.9% over the past month, Bitcoin is not breaking down, yet it is not reclaiming strength either.
That leaves traders focused on a single level that could quickly shift momentum. With volatility tightening and range boundaries well defined, the next clean move above or below resistance may decide whether Bitcoin reclaims momentum or stays trapped in short-term limbo.
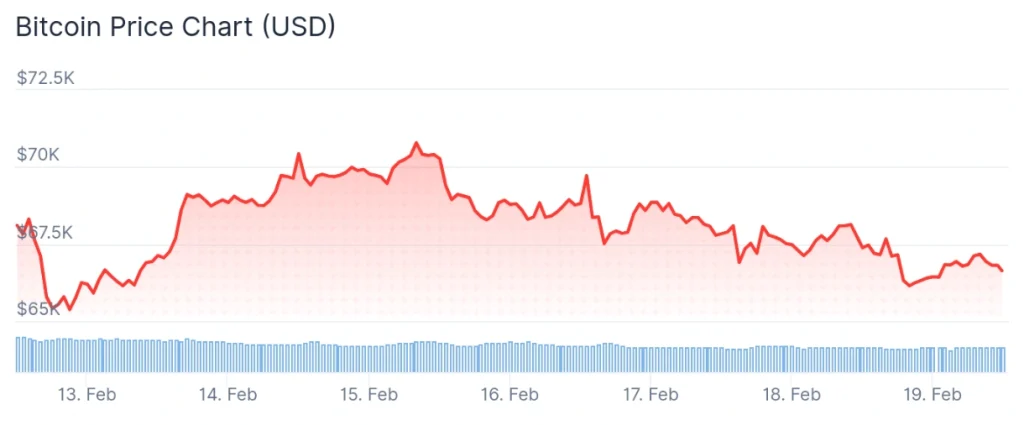
Bitcoin Price Today
More Must-Reads:
How do you rate this article?
Subscribe to our YouTube channel for crypto market insights and educational videos.


Join our Socials
Briefly, clearly and without noise – get the most important crypto news and market insights first.
Most Read Today
1
Exclusive: $250M Asset Manager Breaks Down Morgan Stanley’s Bitcoin ETF Impact
2Jim Cramer Prediction Accuracy: Full Report (2000–2026)
3XRP Whales Buying Rises Ahead of Major Ripple XRPL Japan Event
4Bitcoin Jumps to Three-Week High as Crypto Adds $100B
510K BTC at $50 Got Zero Bids, Now It’s Worth Hundreds of Millions
Latest


8
Also read
Similar stories you might like.

Blockchain
FBI Warning: Crypto Losses Hit $11B as Scams Surge
Ana | 2026-04-08

Altcoins
Bitcoin Jumps to Three-Week High as Crypto Adds $100B
Ana | 2026-04-08
Altcoins
Unleashing STRIDE: Could It Spark Thrilling Gains for Solana?
Azeez | 2026-04-08

Altcoins
Van Rossem Upgrade in Focus—Could It Trigger Cardano’s Next Big Price Move?
Azeez | 2026-04-08

Bitcoin
Quantum Threat: Experts Say Bitcoin Encryption May Not Last a Decade
Ana | 2026-04-08

Defi
Reshaping Payments: FDIC Moves to Set Rules for Stablecoin Issuers
Rokas | 2026-04-08

Bitcoin
10K BTC at $50 Got Zero Bids, Now It’s Worth Hundreds of Millions
Rokas | 2026-04-08

Market
Jim Cramer Prediction Accuracy: Full Report (2000–2026)
Sead | 2026-04-08

Bitcoin
Exclusive: $250M Asset Manager Breaks Down Morgan Stanley’s Bitcoin ETF Impact
Sead | 2026-04-08

Bitcoin
Bitcoin Rejects $70K as Geopolitical Tensions Rise
Ana | 2026-04-07