


XRP coin stacks. Source: TechGaged / Shutterstock
XRP Retest Sparks Bold $33 Target Talk
In Brief
- • XRP has retraced to a key 0.5 Fibonacci level near $0.61.
- • An analyst says the pullback mirrors prior bullish retests.
- • Holding this zone keeps the broader upside structure intact.
Ad
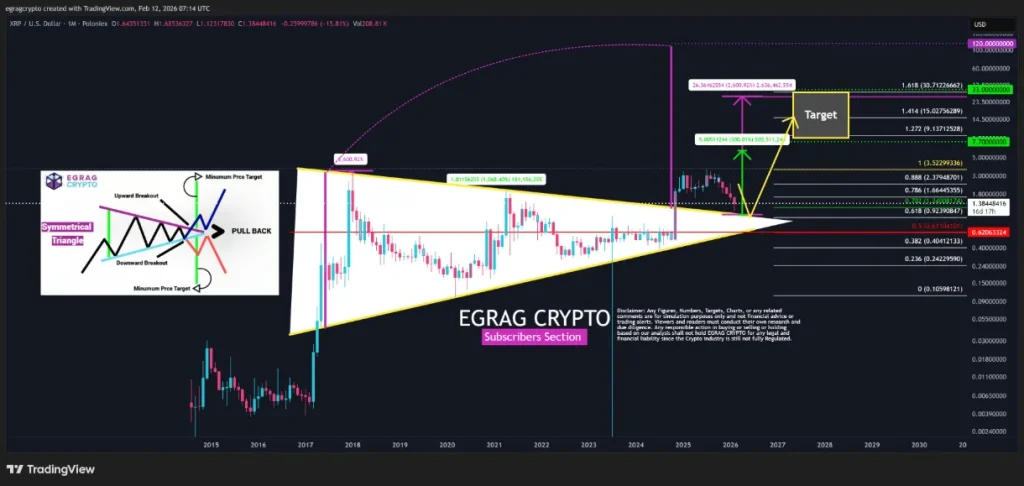
XRP has pulled back to the 0.5 Fibonacci retracement near $0.61, a level one analyst says aligns with prior cycle retests, following a breakout structure and mirroring past patterns where sharp retracements preceded larger upside expansions.
If the level, observed by renowned cryptocurrency market specialist EGRAG CRYPTO in an X post on February 12, holds, the broader bullish structure may remain intact.
What Just Happened?
On the higher timeframe, XRP appears to have completed a breakout from a multi-month structure before returning to test support near $0.61.
The 0.5 Fibonacci retracement is often viewed as a key equilibrium zone, not overly bullish, not overly bearish, but historically important in XRP’s prior cycles.
According to the analysis, previous cycles followed a similar sequence, including breakout from consolidation, sharp retracement, and a measured move continuation higher.
The retest itself doesn’t invalidate the structure, but in fact may be part of it.
Why This Level Matters
The $0.61 area represents a technically significant inflection point. If the price stabilizes here and forms higher lows, the larger trend structure could remain constructive.
However, if XRP decisively breaks below this zone, traders may look toward deeper retracement levels before any continuation attempt.
The setup also highlights a recurring market dynamic of conviction during volatility. Historically, long-term entries often occur when sentiment is weakest, not when momentum is obvious.
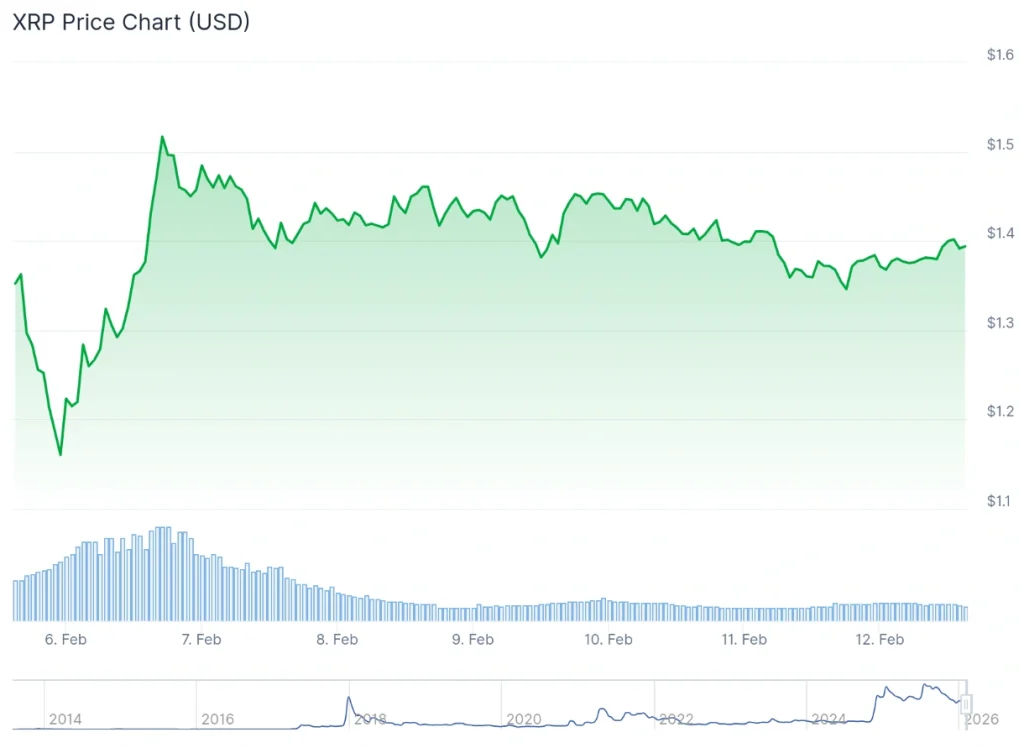
For the time being, the price of XRP currently stands at $1.39, which suggests a 0.4% decline on the day, 3.1% increase over the week, and a loss of 33% accumulated across the past month, per the latest chart data.
What Comes Next?
Traders will be watching for a confirmed hold of the 0.5 Fibonacci level, strong monthly or weekly closes, and reclaiming nearby resistance zones.
If support holds, the broader bullish roadmap remains viable. If it fails, the structure shifts, and patience may be tested before any renewed upside attempt.
All things considered, XRP now sits at a structurally important level, and how the price reacts here could define its next major trend phase.
XRP Price Today
More Must-Reads:
How do you rate this article?
Subscribe to our YouTube channel for crypto market insights and educational videos.


Join our Socials
Briefly, clearly and without noise – get the most important crypto news and market insights first.


8
Also read
Similar stories you might like.

Industry
Trump Backs Bitcoin, Stablecoins In New Pro-Crypto Push
Ana | 2026-03-30
Industry
Canada Proposes Ban on Crypto Political Donations
Ana | 2026-03-30

Altcoins
Ethereum Foundation Makes Record ETH Staking Move
Ana | 2026-03-30
Bitcoin
Bitcoin Miners Turn to AI as Profits Collapse
Ana | 2026-03-30
Bitcoin
Mystery Deepens as $400M ‘Lost’ Bitcoin Suddenly Moves
Rokas | 2026-03-30

Altcoins
Kiyosaki Warns of Inflation Crisis, Lists 6 Safest Investments for 2026
Rokas | 2026-03-30

Altcoins
TRON Moves Toward Institutions: How Anchorage Support Could Influence TRX Price
Azeez | 2026-03-29
Altcoins
Gold Enters DeFi: Tether’s XAUt Expansion to BNB Chain Could Shift Market Dynamics
Azeez | 2026-03-29
Altcoins
Sui Approaches 800K Users as Token Unlock Nears — Can Price Stay Resilient?
Azeez | 2026-03-29

Altcoins
Could SpaceX’s IPO Be the Catalyst That Sends Dogecoin Above $0.10?
Azeez | 2026-03-29