


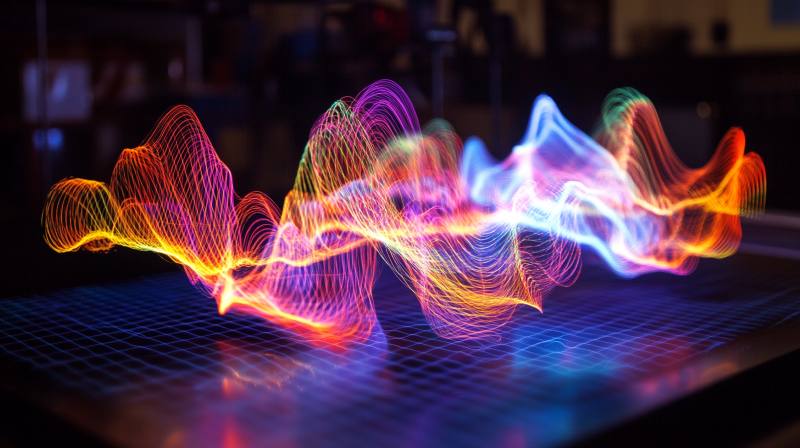
This hack lets you ‘see’ electromagnetic waves in action
Wouldn’t it be fun if you could see electromagnetic waves by yourself? Now you can, by turning a Pluto radio into a spectrum analyzer that sweeps anything from 100 MHz to 6 GHz, all you need is a little bit of technical know-how and some patience.
Ad
Indeed, using the system’s lock-in amplifier technique and the straightforward Python code, you can scan all frequencies and observe electromagnetic activity, including WiFi, Bluetooth, radio systems, both commercial and amateur, and even cell phones.
And the best part? You’ll also be able to detect anomalies that could indicate hidden transmitters in your surroundings.
As it happens, an engineer known as ‘From Concept to Circuit’ has devised a way to do just that using an ADALM Pluto SDR turned into a real-time Spectrum Analyzer using Python and PyQt, explaining the whole process in a YouTube video and on GitHub, alongside code and all the necessary tools.
Ad
How to ‘see’ electromagnetic waves
To begin, the engineer needed several things – ADALM Pluto SDR (software-defined radio active learning module), Python 3 code, PyQt6 (GUI framework), PyQtGraph (for real-time graph plotting), as well as NumPy and SciPy (for signal processing and filtering).
Now, it was time to put all these into action. First of all, you need to clone the repository:
| git clone https://github.com/fromconcepttocircuit/ADALM-Pluto-Spectrum-Analyzer.git cd ADALM-Pluto-Spectrum-Analyzer |
Then, install the required Python libraries:
| pip install pyadi-iio numpy scipy pyqt6 pyqtgraph |
If you’re a Linux user, install an additional system package to avoid missing Qt plugin errors:
| sudo apt install libxcb-cursor-dev |
Now, run the spectrum analyzer:
| python spectrum_analyzer.py |
Finally, connect ADALM Pluto SDR, making sure it is reachable at its default IP: 192.168.2.1, adjusting the IP address in the code if necessary:
| self.sdr = adi.ad9361(uri=’ip:192.168.2.1′) |
You’ll need to adjust sweep and settings in GUI, including adjusting sample rate (Hz), setting filter cutoff frequency (Hz), sweep start/stop or the frequency range to scan (Hz), resolution of the sweep (# of points), dB threshold to trigger alerts, and peak hold/markets to analyze signals in detail. The GUI may also require PyQt6-specific themes for proper visualization.

Conclusion
And there you have it – your very own real-time electromagnetic wave spectrum analyzer is ready for you to put to good use and make the invisible visible. If you’re up to some other cool projects, why not try making your own GPS receiver, ‘glasses’ that transcribe text to audio for the blind, or a plasma tube from a kombucha bottle? The possibilities are endless.
How do you rate this article?
Subscribe to our YouTube channel for crypto market insights and educational videos.


Join our Socials
Briefly, clearly and without noise – get the most important crypto news and market insights first.
Most Read Today
1
Peter Schiff Warns of a U.S. Dollar Collapse Far Worse Than 2008
2Dubai Insurance Launches Crypto Wallet for Premium Payments & Claims
3XRP Whales Buy The Dip While Price Goes Nowhere
4Samsung crushes Apple with over 700 million more smartphones shipped in a decade
5Luxury Meets Hash Power: This $40K Watch Actually Mines Bitcoin
Latest


8
Also read
Similar stories you might like.

Automotive
Toyota unveils ‘Wave Maker’ color inspired by glacial depths
Ana | 2025-05-19

Artificial Intelligence
How to build a Warren Buffett AI agent in minutes
Ana | 2025-05-08

Computer &Amp; It
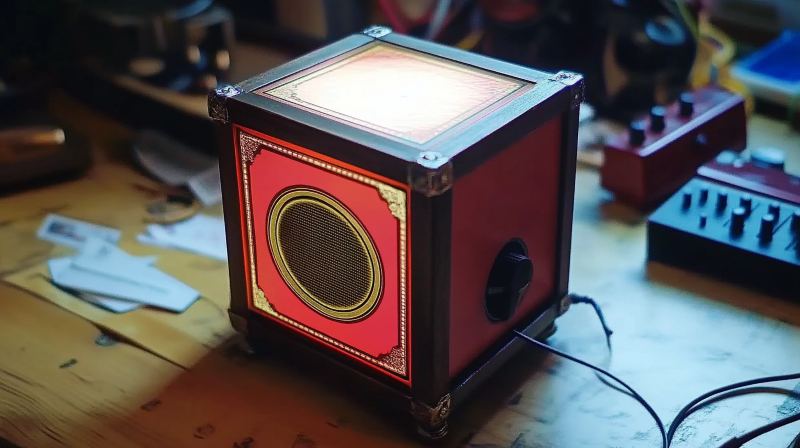
Musician recreates a baroque music computer from 17th-century plans
Ana | 2025-04-14

How To
How to make your own Raspberry Pi elevator
Ana | 2025-04-11

How To
How to turn a vintage typewriter into a printer
Ana | 2025-04-10

How To
How to make your own Super Mario tune fidget toy
Ana | 2025-04-08

Gaming
How to turn your old PlayStation into a ‘Playstacean’
Ana | 2025-04-04
How To
How to make a music box controlled by NFC tags
Ana | 2025-04-02

Automotive
How to transform a boring pedal go-kart into an electric supercar for kids
Ana | 2025-03-26

Computer &Amp; It
How to make your own portable Mac Mini
Ana | 2025-03-26