


Gold Ethereum coin on a textured surface. Source: TechGaged / Shutterstock
Ethereum Fractal Is “Screaming,” Suggests Explosive Rally Ahead
In Brief
- • Analyst sees Ethereum repeating a bullish multi-year fractal.
- • Similar 2019–2020 pattern preceded a major rally.
- • Traders now watch for confirmation of breakout.
Ethereum (ETH) may be flashing a familiar signal, according to a new long-term chart analysis. An analyst argues that ETH is repeating a multi-year fractal. Turns out, this fractal previously preceded an explosive rally.
Monthly Fractal Drawing Attention
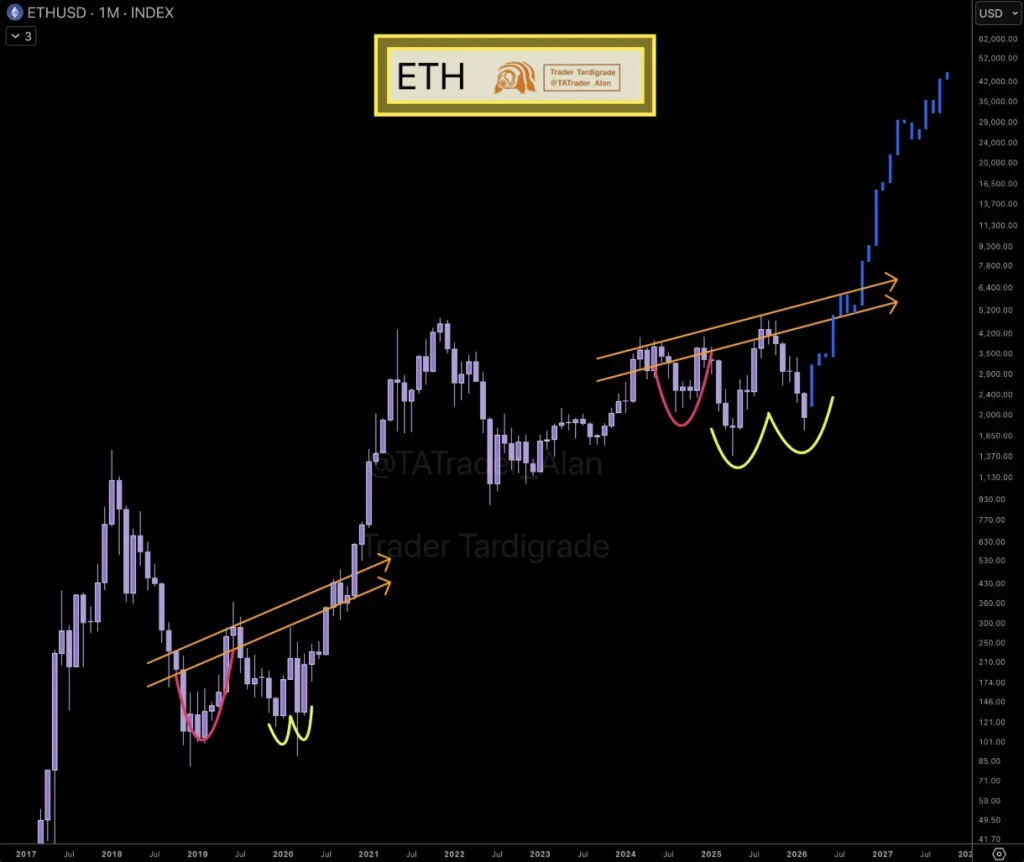
In an X post shared on February 20, prominent cryptocurrency trading specialist Trader Tardigrade highlighted what he calls a repeating Ethereum structure across cycles. The chart compares ETH’s monthly pattern from 2019-2020 with the current 2024-2026 formation.
In the earlier cycle, Ethereum saw an initial dip in 2019, followed by a double-bottom structure through 2020. That phase ultimately led to a strong breakout and the explosive bull market that followed.
The analyst believes the same structure is unfolding again. According to the comparison, Ethereum printed its first major dip in 2024 and is now completing a similar double-bottom formation spanning 2025 and 2026.
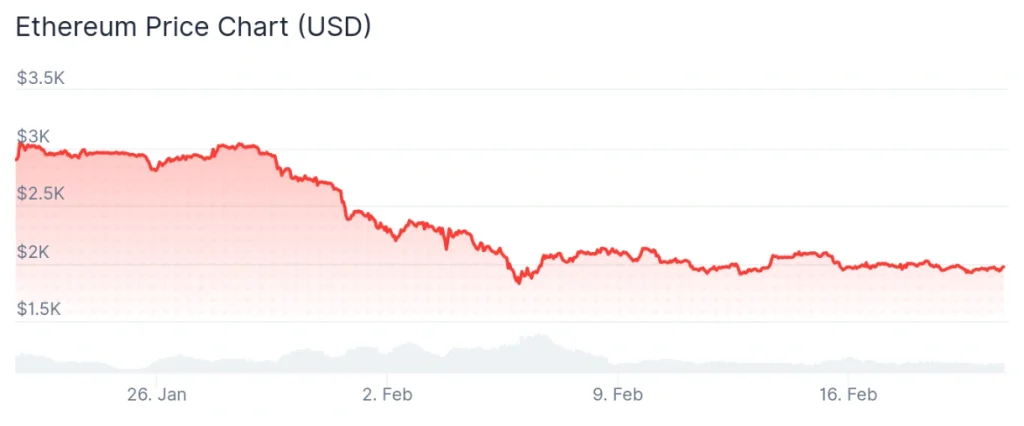
Meanwhile, ETH was at press time trading at the price of $1,968.28, up 2.4% in the last 24 hours, down 3.1% over the past seven days, and accumulating a loss of 34.4% across the month, according to the most recent chart information.
“History Rhymes” Narrative Returns
Fractal analysis has long been popular in crypto markets, where traders search for recurring psychological patterns. Though not predictive on its own, repeating structures often fuel bullish sentiment during consolidation phases.
The idea behind the setup is that, if the structural similarities hold, Ethereum could be entering the final accumulation stage before a large upside expansion. The chart highlights rising trend channels and higher lows forming alongside the double-bottom structure.
Supporters of the fractal thesis argue that Ethereum’s broader fundamentals, including scaling upgrades and institutional interest, could reinforce the technical outlook.
Still, skeptics caution that fractals can break down, especially in changing macro environments. Unlike earlier cycles, Ethereum now trades in a market shaped by exchange-traded funds (ETFs), tighter liquidity conditions, and stronger regulatory scrutiny.
Even so, the chart has sparked renewed discussion about where Ethereum sits in the current cycle. If the pattern continues to play out, traders will be watching closely for confirmation signals that the projected rebound is underway.
For now, the fractal narrative adds another bullish angle to the growing debate over Ethereum’s long-term trajectory, and if history is once again preparing to rhyme.
More Must-Reads:
How do you rate this article?
Subscribe to our YouTube channel for crypto market insights and educational videos.


Join our Socials
Briefly, clearly and without noise – get the most important crypto news and market insights first.


8
Also read
Similar stories you might like.

Altcoins
3 Cryptocurrencies to Avoid in April
Azeez | 2026-04-11

Altcoins
Solana Price Outlook as SOL Hits 167M Users in April
Azeez | 2026-04-11

Altcoins
2 Cryptocurrencies to Buy in April
Azeez | 2026-04-11

Altcoins
CME Group To Launch Sui Futures and Institutions Are Betting Big On It
Azeez | 2026-04-11

Bitcoin
Bitcoin Holds Ground as Oil and War Headlines Clash
Ana | 2026-04-10
Altcoins
Will BNB Chain’s Annual Percentage Yield Surge Push Prices Higher or Be a Trap?
Azeez | 2026-04-10

Bitcoin
The Ceasefire Trade: Why Gold is Testing $5000 While Bitcoin Struggles to Break $75,000
Azeez | 2026-04-10

Blockchain
Exclusive: Dr. Persichetti Challenges Key Claims in Cointelegraph’s Quantum Crypto Analysis
Sead | 2026-04-10

Altcoins
TON Just Got 10× Faster Overnight; Here’s What Happened
Ana | 2026-04-10

Altcoins
Tokenized Commodities Hit $5.1B, Nearly All on Ethereum
Ana | 2026-04-10