


Dollar Index Near Key Level That Previously Ignited Bitcoin Rallies
Ad
Bitcoin (BTC) traders may want to keep a close eye on the U.S. dollar, as previous breakdowns in the Dollar Index have coincided with some of Bitcoin’s most explosive rallies.
Indeed, the U.S. Dollar Index (DXY) is now hovering near 97, and markets are approaching a level that has mattered before, according to the observations shared by renowned cryptocurrency trading expert Matthew Hyland in an X post on January 25.

Why This Level Matters for Bitcoin
Specifically, Hyland has highlighted a striking historical pattern tied to the DXY.
The last two times, DXY decisively broke below 96, Bitcoin entered powerful bull runs. In 2017, Bitcoin surged from roughly $2,000 to $20,000 within six months. In 2020-2021, it climbed from about $10,000 to $64,000 over nine months.
In both cases, sustained dollar weakness coincided with expanding global liquidity and rising appetite for risk assets. Today, DXY sits near 97, just above that historically significant zone.
How Dollar Strength Shapes Bitcoin Cycles
Bitcoin has long shown sensitivity to dollar liquidity conditions. A strong dollar often tightens global financial conditions, pressuring speculative and risk-sensitive assets. Conversely, when the dollar weakens, capital tends to flow toward alternatives like equities, commodities, and crypto.
Hyland’s earlier analysis flagged 96 as a key inflection level, where previous dollar breakdowns aligned with shifts in macro momentum. Though correlation doesn’t guarantee repetition, the level has repeatedly acted as a trigger point for broader market repricing.
What This Means for Bitcoin’s Outlook
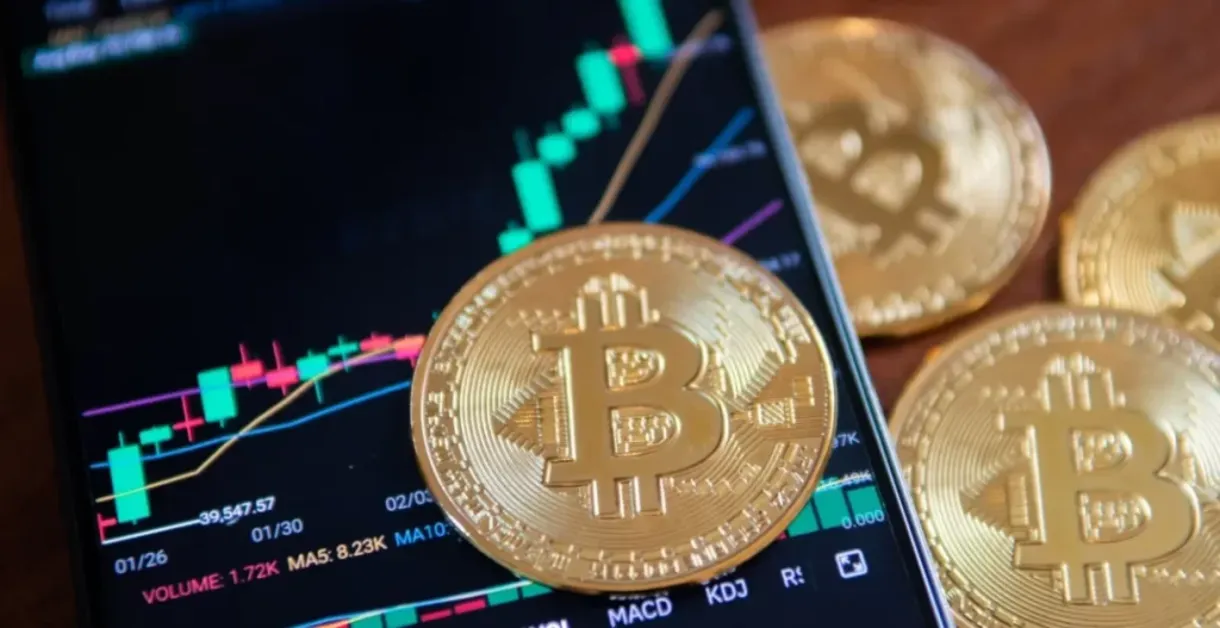
Meanwhile, BTC is trading at $87,852.43, recording a 0.1% gain on the day, declining 3.5% across the week, and advancing 0.1% on its monthly chart, according to the most recent price information.

A move below 96 would not automatically ignite another parabolic Bitcoin rally, but history suggests it would greatly change the macro backdrop.
If the dollar continues to soften, Bitcoin could benefit from improving liquidity conditions and renewed risk appetite. If DXY holds firm or rebounds, crypto markets may remain range-bound.
For now, Bitcoin appears to be waiting on the USD’s next move.
Bitcoin Price Today
More Must-Reads:
How do you rate this article?
Subscribe to our YouTube channel for crypto market insights and educational videos.


Join our Socials
Briefly, clearly and without noise – get the most important crypto news and market insights first.

Most Read Today
1
Chainlink’s 499% Social Volume Spike: Why Attention is Outpacing Price
2Cardano (ADA) Price Analysis: Quiet Accumulation as Technical Signals Begin to Strengthen
3Mantle’s $1B Milestone: Why MNT is the Next Layer 2 Powerhouse to Watch
4Digital Silver’s Silent Strength: Litecoin (LTC) Fundamental and Technical Dive
5Zcash: The VC-Backed Rebirth of Private Finance
Latest


8
Also read
Similar stories you might like.

Altcoins
Chainlink’s 499% Social Volume Spike: Why Attention is Outpacing Price
Azeez | 2026-03-15

Altcoins
The Institutional Push: Why the Aptos & Mastercard Alliance is a High-Stakes Bet for 2026
Azeez | 2026-03-14
Altcoins
The Institutional Green Light: Analyzing AVAX as Grayscale’s Staking ETF Hits Nasdaq
Azeez | 2026-03-14

Altcoins
The Pi Day Pivot: Can Polkadot’s Massive Supply Cut Fuel a DOT Breakout?
Azeez | 2026-03-14

Altcoins
Ethereum Foundation Drops New Manifesto For The Network; What’s New?
Ana | 2026-03-13

Altcoins
XRP Triangle Pattern Points To Major Upside Target
Ana | 2026-03-13

Altcoins
Whales Quietly Scoop Up Millions Of TRUMP Tokens; What’s Happening?
Rokas | 2026-03-13

Bitcoin
Supply Shock: 204K BTC Leave Exchanges As Whales Stay Dormant
Rokas | 2026-03-13

Bitcoin
Record Strategy Bitcoin Purchase Raises Supply Pressure Questions
Rokas | 2026-03-13

Bitcoin
Should You Sell Bitcoin at $100K? Here’s What ChatGPT Says
Rokas | 2026-03-12