


Dogecoin coin stack. Source: TechGaged / Shutterstock
Dogecoin Slides to Critical Lows as Bulls Face a Make-or-Break Moment
In Brief
- • Dogecoin is testing major monthly support.
- • Similar setups previously preceded bull runs.
- • Monthly closes will confirm or invalidate the pattern.
Ad
Dogecoin (DOGE) has revisited a major historical support level on the monthly chart, a structure that previously preceded strong bull runs. The pattern mirrors breakdowns seen in 2016 and 2019-2020 before major upside moves.
If the setup, identified by popular cryptocurrency trading expert Trader Tardigrade in an analysis shared in an X post on February 12, holds, the current pullback could mark a late-cycle reset rather than a prolonged downtrend.
What Just Happened?
On the monthly timeframe, Dogecoin has retraced toward prior structural lows in a move that in past cycles acted as a turning point.
The chart highlights three key periods, including the 2016 breakdown to prior support before the 2017 rally, the 2019-2020 retrace ahead of the 2021 surge, and the current cycle in which the price is revisiting historical support once again.
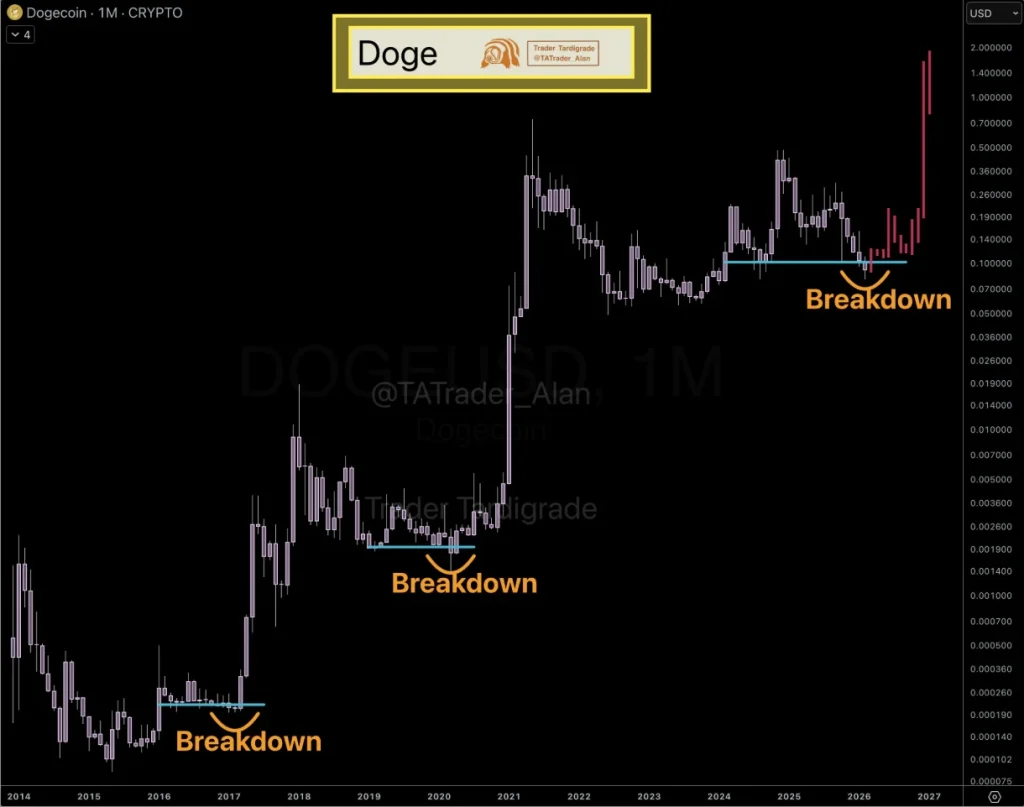
As the analyst noted:
“When Dogecoin makes a major breakdown to a previous low, that’s often when it begins a new uptrend.”
Why This Pattern Matters
Long-term breakdowns that sweep previous lows are often interpreted as liquidity events, clearing weak positions before trend reversals.
If history rhymes, the current structure could represent accumulation rather than structural collapse.
However, historical symmetry alone is not confirmation. Broader crypto sentiment, Bitcoin (BTC) trend, and macro conditions remain key drivers.
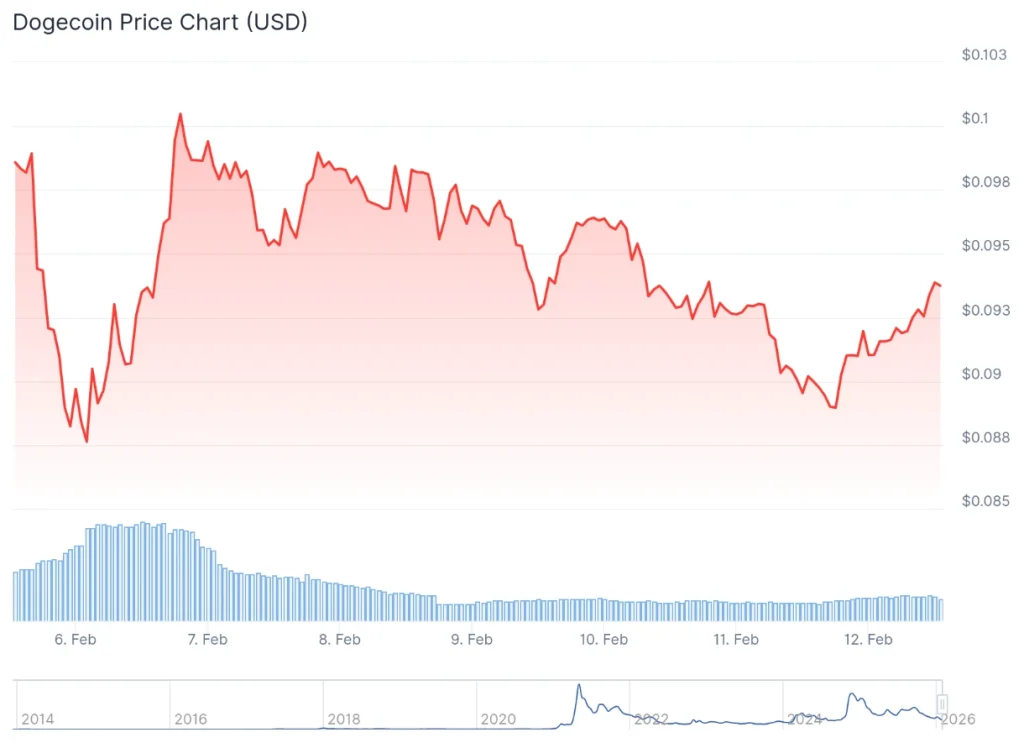
Currently, DOGE is changing hands at the price of $0.09375, indicating a gain of 3.9% on the day, having lost 4.9% across the week, and a accumulating a loss of 32.7% over the past month, per the most recent chart information.
What Comes Next?
For bulls, validation would require strong monthly closes, reclaiming key resistance levels, and sustained momentum above prior breakdown zones. Where bears are concerned, a decisive loss of historical support would invalidate the cyclical pattern and open the door to deeper downside.
For now, Dogecoin’s structure resembles prior cycle bottoms, but the next monthly closes will likely determine whether the pattern repeats or fails.
Dogecoin Price Today
More Must-Reads:
How do you rate this article?
Subscribe to our YouTube channel for crypto market insights and educational videos.


Join our Socials
Briefly, clearly and without noise – get the most important crypto news and market insights first.


8
Also read
Similar stories you might like.

Industry
Trump Backs Bitcoin, Stablecoins In New Pro-Crypto Push
Ana | 2026-03-30

Industry
Canada Proposes Ban on Crypto Political Donations
Ana | 2026-03-30

Altcoins
Ethereum Foundation Makes Record ETH Staking Move
Ana | 2026-03-30

Bitcoin
Bitcoin Miners Turn to AI as Profits Collapse
Ana | 2026-03-30

Bitcoin
Mystery Deepens as $400M ‘Lost’ Bitcoin Suddenly Moves
Rokas | 2026-03-30

Altcoins
Kiyosaki Warns of Inflation Crisis, Lists 6 Safest Investments for 2026
Rokas | 2026-03-30

Altcoins
TRON Moves Toward Institutions: How Anchorage Support Could Influence TRX Price
Azeez | 2026-03-29
Altcoins
Gold Enters DeFi: Tether’s XAUt Expansion to BNB Chain Could Shift Market Dynamics
Azeez | 2026-03-29

Altcoins
Sui Approaches 800K Users as Token Unlock Nears — Can Price Stay Resilient?
Azeez | 2026-03-29

Altcoins
Could SpaceX’s IPO Be the Catalyst That Sends Dogecoin Above $0.10?
Azeez | 2026-03-29