


Shiba Inu dog associated with Dogecoin. Source: TechGaged / Shutterstock
DOGE Forms Bullish Falling Wedge Against Bitcoin; What It Means
In Brief
- • DOGE/BTC is forming a bullish falling wedge.
- • Dogecoin’s monthly RSI is at historic lows.
- • Signals suggest a possible trend reversal.
Ad
Dogecoin (DOGE) may be approaching a technical turning point as multiple chart indicators begin flashing potential reversal signals. Its monthly RSI has reached its lowest level, a zone that historically coincides with the end of major downtrends. At the same time, the DOGE/BTC trading pair is forming a falling wedge pattern, a structure traders often interpret as bullish.
Dogecoin RSI Signals Possible Trend Shift
On the monthly timeframe, Dogecoin’s Relative Strength Index (RSI) has dropped to levels rarely seen in the asset’s history, according to analysis shared by prominent cryptocurrency market expert Trader Tardigrade in an X post on March 6.
RSI is a momentum indicator that measures the speed and magnitude of price movements. When it falls toward the lower end of its range, it can signal that selling pressure may be reaching exhaustion.
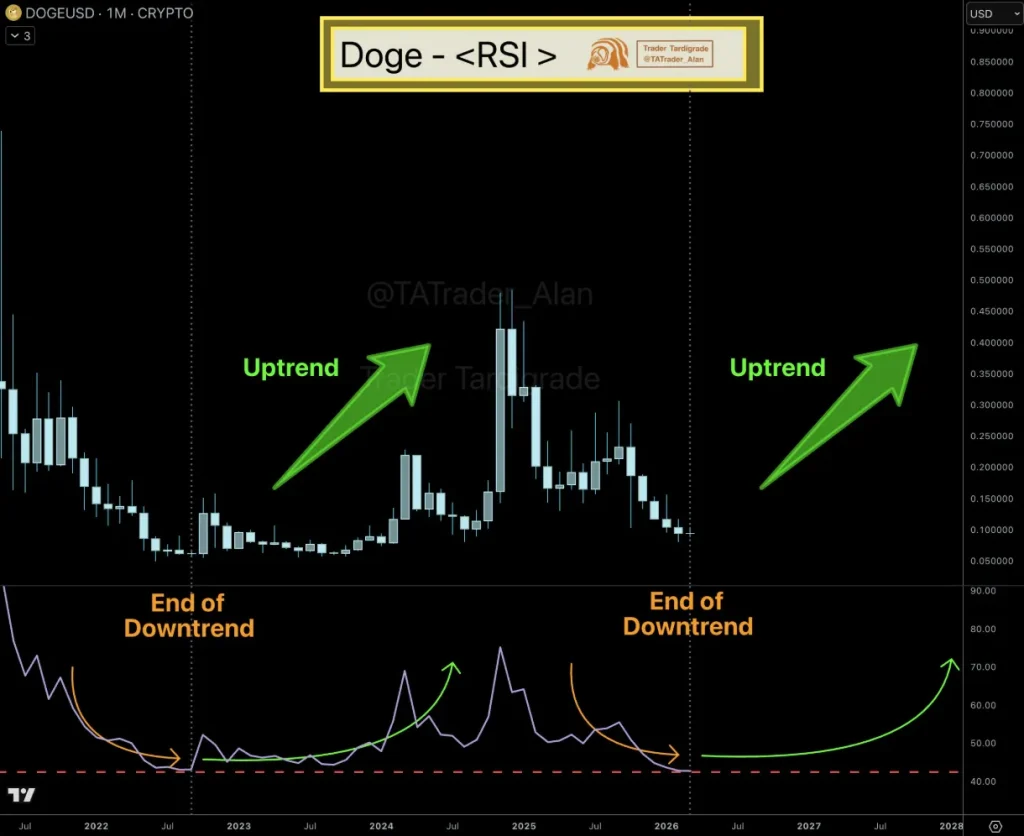
In the chart shared by the analyst, previous periods where RSI reached similarly low levels were followed by strong upward trends. The current reading suggests that the prolonged downtrend could be nearing its final stage if momentum begins shifting back toward buyers.
However, RSI alone does not confirm a reversal. Traders typically watch for additional technical patterns before interpreting it as a sustained trend change.
DOGE/BTC Falling Wedge Forms
Another chart focuses on the Dogecoin to Bitcoin trading pair, which shows a falling wedge pattern developing on the weekly timeframe.
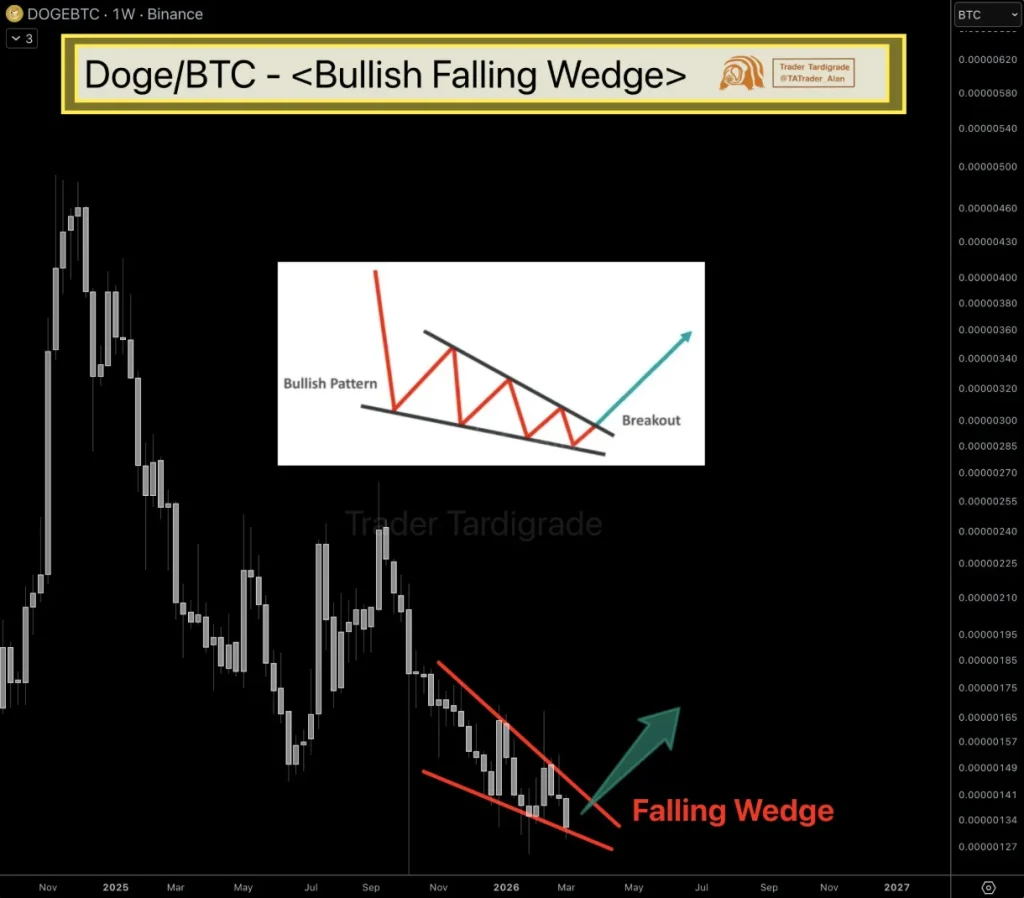
A falling wedge occurs when the price forms a narrowing downward channel with lower highs and lower lows. Though the pattern reflects declining momentum, it often precedes a breakout once the price escapes the upper boundary of the wedge.
Technical analysts consider the structure bullish because it indicates that downward pressure is weakening. If the wedge resolves to the upside, DOGE could begin outperforming Bitcoin again after an extended period of relative weakness.
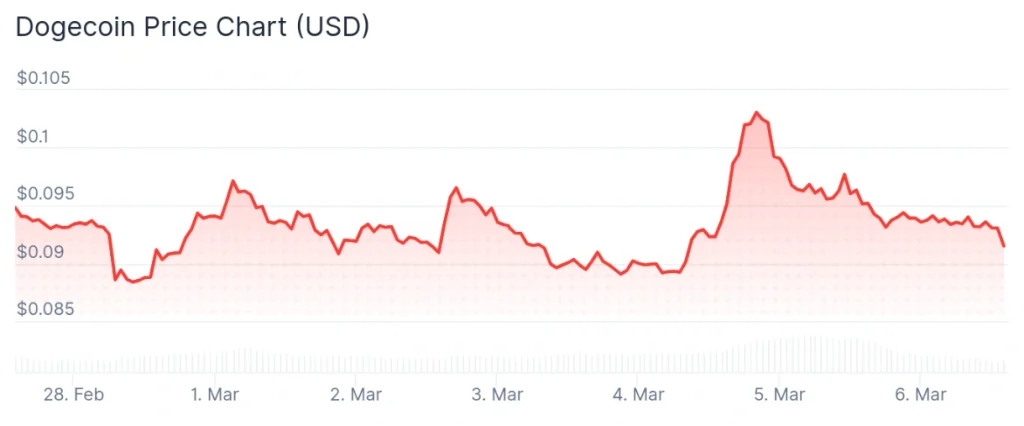
For the time being, Dogecoin is trading at $0.09173, down 3.8% on the day, 7.3% across the week, and 14.6% in the last month, according to the most recent price chart information.
Taken together, the RSI signal and the falling wedge pattern suggest that Dogecoin may be entering a phase where a broader trend shift becomes possible if buying pressure returns.
More Must-Reads:
How do you rate this article?
Subscribe to our YouTube channel for crypto market insights and educational videos.


Join our Socials
Briefly, clearly and without noise – get the most important crypto news and market insights first.
Most Read Today
1
4 Events That Could Break Michael Saylor’s Bitcoin Strategy
2Bitcoin Hashrate Surges 50% In One-Month Recovery – What It Means
3XRP Rally Could Exceed 600%, Analyst Says
4XRP ETFs Cross $1B Assets As Investors Accumulate; What’s Next?
5Ethereum Trader Turns One Trade Into Nearly $1M; Here’s How
Latest


8
Also read
Similar stories you might like.

Industry
Pakistan Launches National Crypto Regulator; What’s Next?
Rokas | 2026-03-06

Bitcoin
Bitcoin Wallets Hit Record 58.45M As Exchange Supply Falls
Ana | 2026-03-06

Bitcoin
Large Jane Street Bitcoin Transfers Detected Onchain
Ana | 2026-03-06

Industry
Russia Proposes Crypto Exchange Licenses For Banks
Ana | 2026-03-06

Crypto News
4 Events That Could Break Michael Saylor’s Bitcoin Strategy
Sead | 2026-03-06

Altcoins
XRP Rally Could Exceed 600%, Analyst Says
Rokas | 2026-03-05

Bitcoin
Bitcoin Overlay With Nikkei Points To Multi-Year Rally
Ana | 2026-03-05

Altcoins
Ethereum Trader Turns One Trade Into Nearly $1M; Here’s How
Ana | 2026-03-05
Altcoins
XRP ETFs Cross $1B Assets As Investors Accumulate; What’s Next?
Ana | 2026-03-05

Bitcoin
Bitcoin Hashrate Surges 50% In One-Month Recovery – What It Means
Rokas | 2026-03-05