


SUIs Network logo on a smartphone screen with numbers from a chart in the back.
CME Group To Launch Sui Futures and Institutions Are Betting Big On It
In Brief
- • CME futures launch and institutional products signal strong growing interest in SUI.
- • Technical indicators show early bullish divergence despite prolonged price weakness.
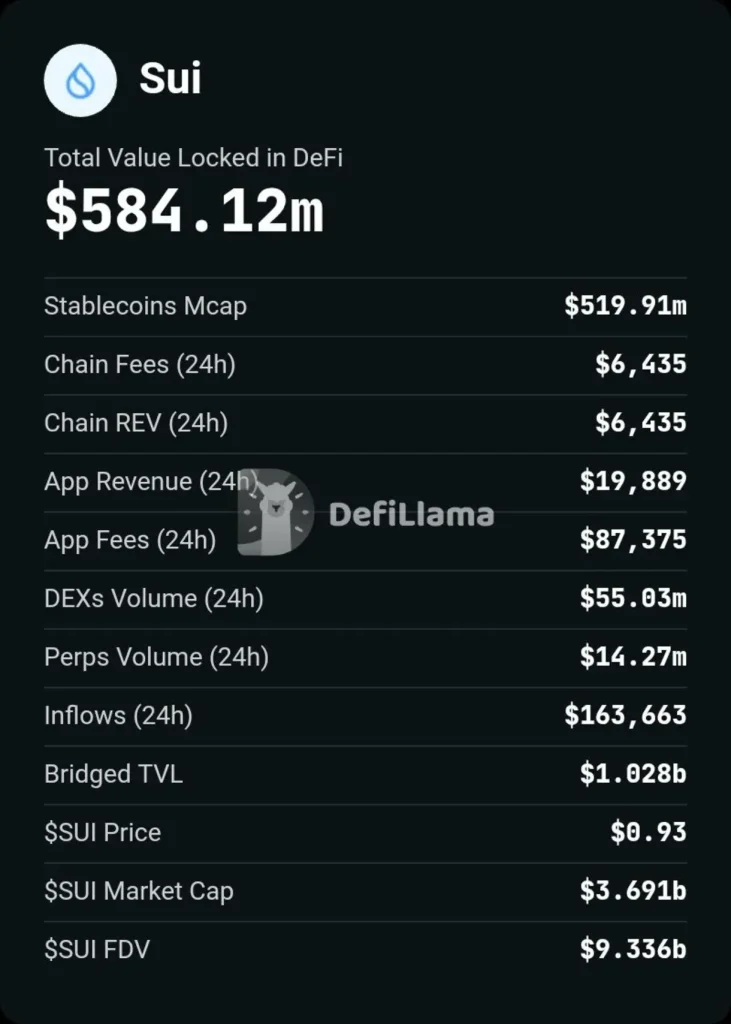
- • Rising TVL and stablecoin growth highlight strengthening ecosystem fundamentals.
On April 7, 2026, CME Group announced plans to launch standard and micro-sized Sui futures contracts, with trading scheduled for May 4, pending regulatory review.
Giovanni Vicioso, CME’s Global Head of Crypto Products, cited sustained institutional demand.
The exchange noted March crypto derivatives volume averaged nearly $8 billion daily, up 19% year-over-year.
Institutions Are Already Here
Over $300 million has been allocated to SUI-based exchange-traded products globally.
Grayscale, VanEck, Franklin Templeton, and Canary Capital have all launched Sui products.
The Grayscale Sui Trust holds about $24 million in AUM. Nasdaq filed with the SEC to list the 21Shares SUI spot ETF and has been trading since February 2026. Meanwhile, Sui’s TVL in DeFi has climbed past $584 million.
Are the Weekly Charts Flashing a Hidden Bullish Signal?
On the SUI/USD weekly chart (April 11, 2026 — 07:57 UTC), price trades near $0.9388, down 82% from its $5.35 all-time high.
The Parabolic SAR dots remain above price for the seventh consecutive week, confirming the corrective trend is intact.
However, the MACD is showing notable improvement: the histogram has compressed from -0.045 to -0.032 over the past month, and the MACD line is within 0.003 of crossing above the signal line.
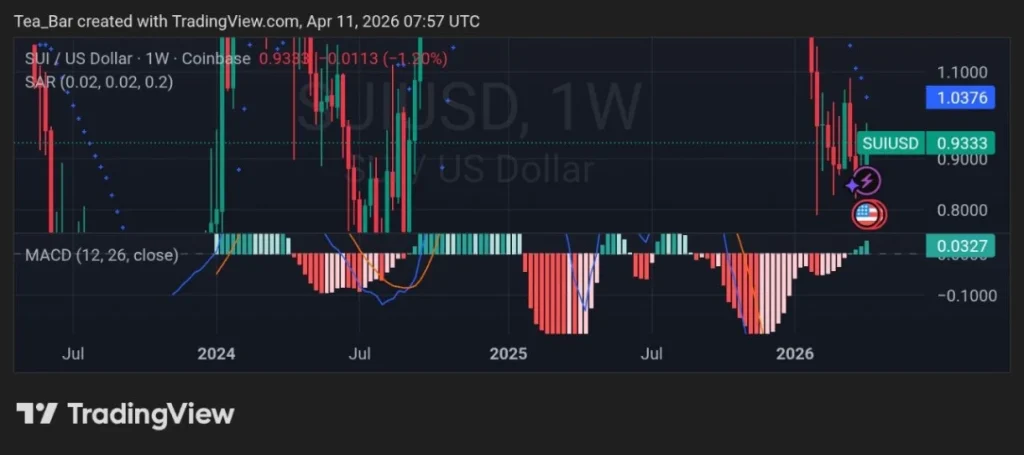
This move marks the first bullish crossover since November 2025. Support has formed a higher low at $0.85, up from the January low of $0.80, suggesting selling pressure is waning.
Also, on the SUI/BTC weekly chart, price trades around 0.00001285 BTC, the RSI Divergence Indicator has printed a clear “Bull” tag at 33.00.
This is a textbook bullish divergence: price made a lower low of 0.00001150 BTC in March, but RSI made a higher low of 31.00, signaling exhausted downside momentum.
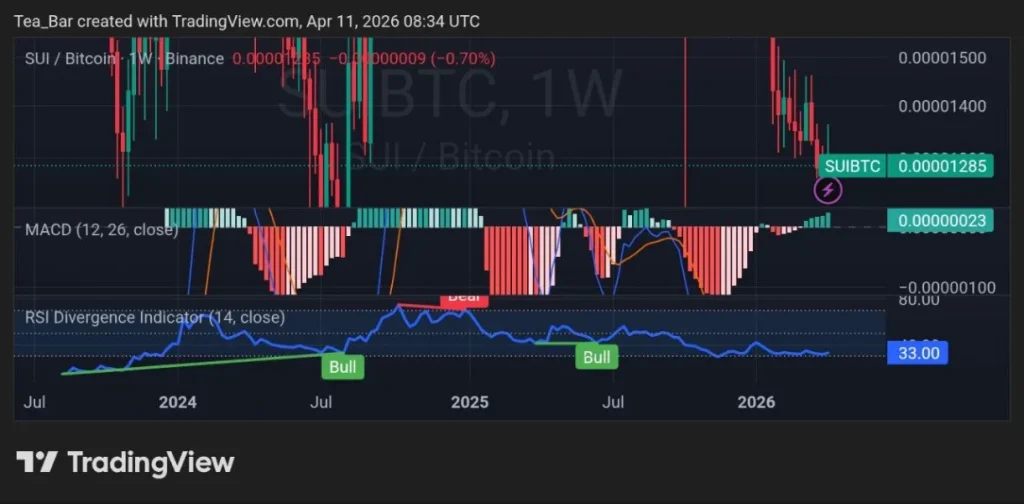
The MACD histogram has moved from -0.0000012 to -0.0000008 over two weeks.
The current SUI/BTC ratio is 63% below its 2025 peak – a level of underperformance that historically precedes sharp reversals for altcoins with strong fundamentals.
Will the May 4 CME Launch Finally Break the Consolidation?
The divergence between Sui’s fundamentals and its price is striking. Institutions are piling in, TVL is climbing, and CME futures are coming.
Yet SUI sits near $0.94, still 82% below its peak. The weekly charts against Bitcoin are flashing early reversal signals.
The question is not whether institutions are interested – they already are. The question is whether the market will finally price in the momentum before the May 4 launch.
How do you rate this article?
Subscribe to our YouTube channel for crypto market insights and educational videos.


Join our Socials
Briefly, clearly and without noise – get the most important crypto news and market insights first.
Most Read Today
1
Exclusive: Dr. Persichetti Challenges Key Claims in Cointelegraph’s Quantum Crypto Analysis
2Exchange Seeks Asset Freeze as Users Refuse to Return BTC
3Tokenized Commodities Hit $5.1B, Nearly All on Ethereum
4Will BNB Chain’s Annual Percentage Yield Surge Push Prices Higher or Be a Trap?
5Exclusive: $250M Asset Manager Breaks Down Morgan Stanley’s Bitcoin ETF Impact
Latest


8
Also read
Similar stories you might like.

Altcoins
2 Cryptocurrencies to Buy in April
Azeez | 2026-04-11

Bitcoin
Bitcoin Holds Ground as Oil and War Headlines Clash
Ana | 2026-04-10
Altcoins
Will BNB Chain’s Annual Percentage Yield Surge Push Prices Higher or Be a Trap?
Azeez | 2026-04-10

Bitcoin
The Ceasefire Trade: Why Gold is Testing $5000 While Bitcoin Struggles to Break $75,000
Azeez | 2026-04-10

Altcoins
Trump-Linked WLFI Crypto Play Raises Eyebrows Again
Rokas | 2026-04-10

Altcoins
Crypto Market Loses $50B After Bitcoin Rejection
Ana | 2026-04-09

Altcoins
Massive Fartcoin Long Ends in $3M Loss, Shorts Benefit
Ana | 2026-04-09

Altcoins
Wall Street Meme Coin Push: Canary Capital Files for Spot PEPE ETF
Ana | 2026-04-09
Bitcoin
Bitcoin Pioneer Adam Back Rejects Satoshi Identity Claims
Ana | 2026-04-09
Bitcoin
Bitcoin Miners Dump Thousands of BTC — What’s Going on?
Azeez | 2026-04-09