


Gold bar with Bitcoin coin on U.S. dollar bills. Source: TechGaged / Shutterstock
Bitcoin Vs Gold Ratio Near 2022 Bear Market Levels; What Next?
In Brief
- • Bitcoin-to-gold ratio is nearing bear market levels.
- • The metric reflects Bitcoin’s strength vs. gold.
- • Traders are watching a key support zone.
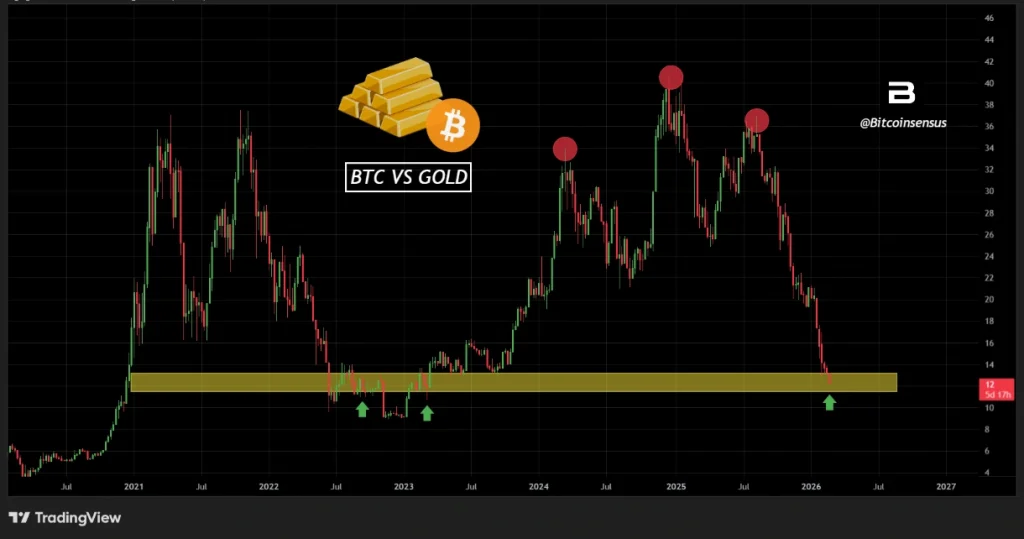
The Bitcoin (BTC) versus gold ratio has dropped back to levels last seen in March 2023. The move puts the ratio less than 25% above its 2022 bear market lows. The shift is drawing attention as traders reassess Bitcoin’s macro strength relative to traditional safe-haven assets.
A Key Macro Chart Returns To Focus
Indeed, the BTC-to-gold ratio tracks how Bitcoin performs against gold rather than against the dollar. Analysts often use it to gauge whether capital is flowing toward risk-on cryptocurrency exposure or defensive assets.
Recent chart data, shared by crypto market analytics account Bitcoinsensus in an X post on February 24, shows the ratio sliding into a long-standing support zone that previously marked major turning points.
Similar levels appeared during the 2022 bear market and again in early 2023, both periods when Bitcoin struggled to outperform hard assets.
The latest retest suggests Bitcoin has been losing relative momentum while gold holds firm. That dynamic has historically appeared during phases of macro uncertainty, tighter liquidity, or defensive positioning across markets.
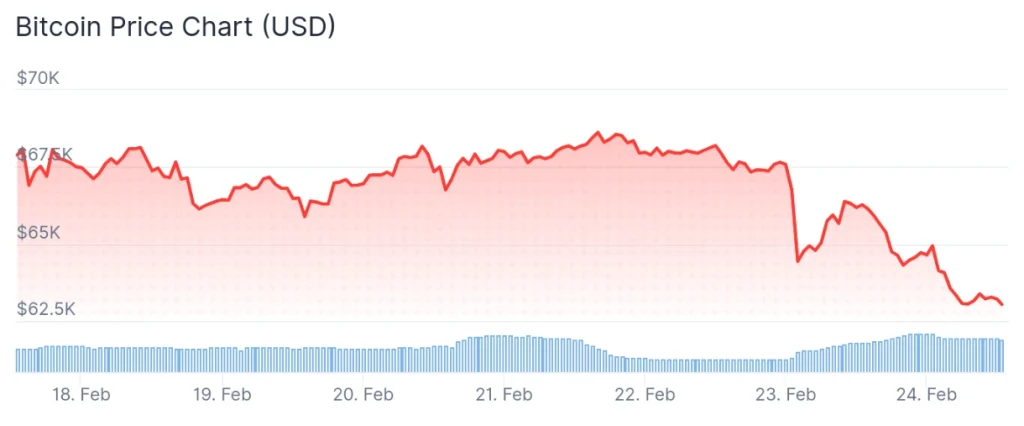
Meanwhile, the original crypto asset was at press time changing hands at the price of $63,020.77, recording a drop of 5% in the last 24 hours, losing 7.1% across the past seven days, and accumulating a dip of 28.7% over the month, per the latest chart data.
Why Traders Are Watching This Level
This ratio matters because it strips away dollar noise and focuses on relative strength. Even when Bitcoin rises in USD terms, underperformance against gold can signal weakening macro demand for risk assets.
If support holds, the chart could form a base similar to prior cycles where Bitcoin later regained dominance. But a breakdown below the 2022 ratio lows would mark a deeper structural shift, potentially reinforcing narratives around capital rotating into commodities and hard money.
Then there’s the timing, in which Bitcoin has increasingly been framed as digital gold, so periods where gold outperforms tend to spark debate about that thesis. Traders often monitor this relationship during macro transitions involving inflation expectations, real yields, or central bank policy shifts.
For now, the ratio sits at a technically sensitive zone. Its potential stabilization or a break lower may shape the next phase of the Bitcoin versus gold narrative, especially as macro conditions remain fluid.
More Must-Reads:
How do you rate this article?
Subscribe to our YouTube channel for crypto market insights and educational videos.


Join our Socials
Briefly, clearly and without noise – get the most important crypto news and market insights first.

Most Read Today
1
3 Cryptocurrencies to Avoid in April
2Arthur Hayes’ $1.1M HYPE Bet: Is ETF Buzz Igniting a Surge?
3April 12 Token Unlock: What it Could Mean for Aptos Price
4Oil Loses $100 Grip — Will Bitcoin Benefit From the Shift?
5Exclusive: Dr. Persichetti Challenges Key Claims in Cointelegraph’s Quantum Crypto Analysis
Latest


8
Also read
Similar stories you might like.
Altcoins
Post-Ceasefire Crypto Outlook: Hangover or Buying Opportunity Ahead?
Azeez | 2026-04-12
Bitcoin
Oil Loses $100 Grip — Will Bitcoin Benefit From the Shift?
Azeez | 2026-04-12

Altcoins
Arthur Hayes’ $1.1M HYPE Bet: Is ETF Buzz Igniting a Surge?
Azeez | 2026-04-12

Altcoins
April 12 Token Unlock: What it Could Mean for Aptos Price
Azeez | 2026-04-12
Altcoins
3 Cryptocurrencies to Avoid in April
Azeez | 2026-04-11
Altcoins
Solana Price Outlook as SOL Hits 167M Users in April
Azeez | 2026-04-11

Altcoins
2 Cryptocurrencies to Buy in April
Azeez | 2026-04-11

Altcoins
CME Group To Launch Sui Futures and Institutions Are Betting Big On It
Azeez | 2026-04-11
Bitcoin
Bitcoin Holds Ground as Oil and War Headlines Clash
Ana | 2026-04-10
Altcoins
Will BNB Chain’s Annual Percentage Yield Surge Push Prices Higher or Be a Trap?
Azeez | 2026-04-10