


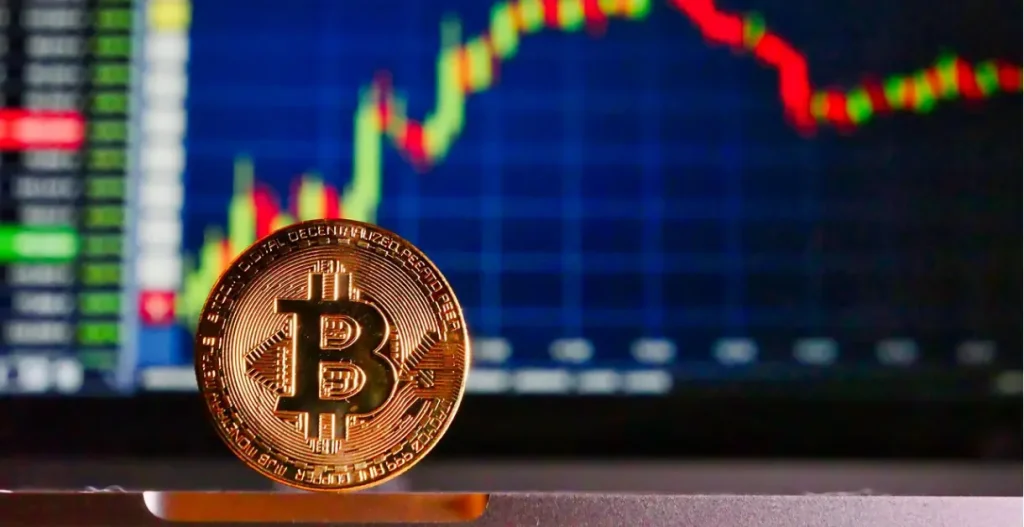
Bitcoin price action showing downside momentum as leverage resets.
Bitcoin Slides Alongside Gold and Silver as Pressure Hits Markets
In Brief
- • Bitcoin’s sharp dip was driven by short-term liquidity stress and exchange inflows.
- • Rising netflows and liquidations point to risk-off positioning as traders reduced leverage.
- • Despite the pullback, on-chain and adoption signals suggest this move looks corrective.
Ad
Bitcoin saw a sharp downside move today, dropping from the mid $88,000 range toward the $84,000 area in just 60 minutes. Moreover, this decline closely mirrored selloffs across gold and silver.
The move unfolded quickly and was accompanied by elevated derivatives activity. Therefore, the drawdown was driven more by positioning and liquidity dynamics than by any deterioration in Bitcoin’s underlying fundamentals.
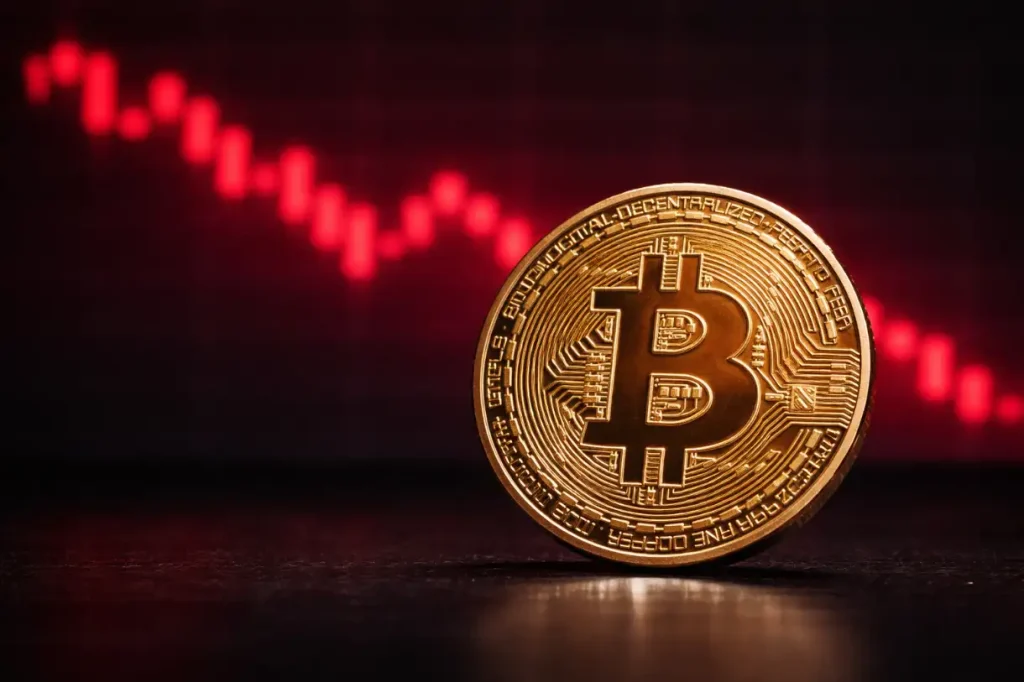
Bitcoin Slides Below Key Levels as Leverage Unwinds
On the daily chart, BTC broke below a short-term support band that had held through much of January. Additionally, the rejection near the $90,000 zone marked another lower high, reinforcing a tightening range that has been developing since late 2025.
Once price slipped below the $86,000 – $85,000 area, sell pressure accelerated, pushing Bitcoin toward the lower end of its recent consolidation.
Furthermore, derivatives data helps us understand the speed behind the move. Indeed, Liquidation heatmaps show a dense cluster of long leverage built up below $88,000, which was rapidly unwound as price moved lower.
In the last 24 hours, total crypto liquidations exceeded $1 billion, with Bitcoin accounting for the largest share.
Therefore, it suggests forced selling played a central role, rather than discretionary spot distribution.
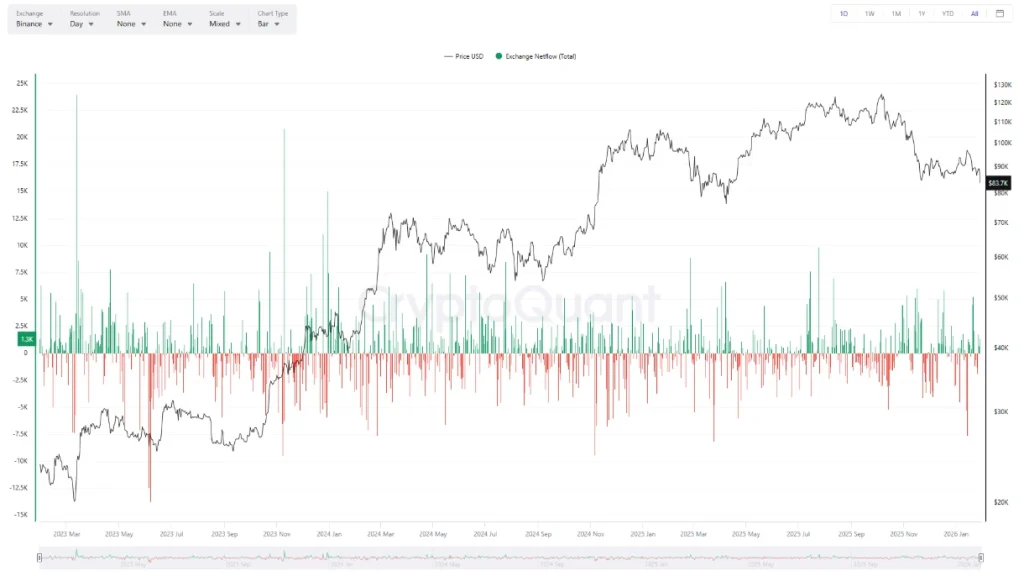
Similarly, netflow data adds further context to the decline. Short-term inflow spikes reappeared during the decline, indicating that some holders moved supply onto exchanges as volatility increased.
Historically, this behavior is aligned with short-term downside pressure, especially during macro-driven risk events.
Importantly, this selloff did not occur in isolation. Indeed, gold and silver both posted sharp intraday declines after reaching fresh highs.
Pointing to a broader de-risking move across traditional and digital stores of value.
What the Pullback Signals for Bitcoin
Despite the sharp price drop, Bitcoin’s structural backdrop remains intact. Moreover, long-term metrics such as active addresses, network usage, and institutional exposure remain elevated relative to prior cycles.
The current move appears to reflect short-term positioning stress in a market that had grown crowded on the long side, rather than a fundamental shift in demand.
Open interest data supports this interpretation. Total BTC open interest has begun to contract following the liquidation wave, indicating leverage is being flushed from the system.
From a market structure perspective, Bitcoin is now testing a zone where prior demand has emerged during earlier consolidations.
If selling pressure continues to ease and inflows slow, this area could serve as a base for renewed balance. However, failure to hold current levels would likely show a deeper retracement toward the lower $80,000.
For now, Bitcoin is reacting to the same macro forces affecting metals and broader risk assets, even as its long-term thesis remains unchanged.
As conditions normalize and leverage resets, the next phase will be defined by whether spot demand reasserts itself or if broader risk aversion continues to weigh on price.
More Must-Reads:
How do you rate this article?
Subscribe to our YouTube channel for crypto market insights and educational videos.


Join our Socials
Briefly, clearly and without noise – get the most important crypto news and market insights first.

Most Read Today
1
Chainlink’s 499% Social Volume Spike: Why Attention is Outpacing Price
2Cardano (ADA) Price Analysis: Quiet Accumulation as Technical Signals Begin to Strengthen
3Mantle’s $1B Milestone: Why MNT is the Next Layer 2 Powerhouse to Watch
4Digital Silver’s Silent Strength: Litecoin (LTC) Fundamental and Technical Dive
5Zcash: The VC-Backed Rebirth of Private Finance
Latest


8
Also read
Similar stories you might like.
Market
Bitcoin Rebounds Despite War Tensions — What Drove Crypto Markets This Week
Sead | 2026-03-09

Market
Sui (SUI) Price Analysis: The Battle Between ETFs and Supply Pressure
Azeez | 2026-03-09
Bitcoin
The “Jane Street 10 AM” Narrative Meets a $68,000 Bitcoin Rally
Patrick | 2026-02-25
Bitcoin
Bitcoin Holds $66K as Liquidity Builds for the Next Major Move
Patrick | 2026-02-18
Bitcoin
Bitcoin’s Fall Just Erased Years of Gains. What Comes Next Matters
Patrick | 2026-02-05
Bitcoin
3 Things That Need to Happen for Bitcoin to Bounce Back
Patrick | 2026-02-04
Crypto News
Trump Announces Kevin Warsh as Nominee for FED Chair
Patrick | 2026-01-30
Crypto News
Peter Schiff Warns of a U.S. Dollar Collapse Far Worse Than 2008
Patrick | 2026-01-29

Crypto News
Cathie Wood: $28 Billion Bitcoin Deleveraging Drove Recent Pullback
Patrick | 2026-01-27
Crypto News
Tether Launches USA₮, a Regulated Dollar-Backed Stablecoin
Patrick | 2026-02-06