


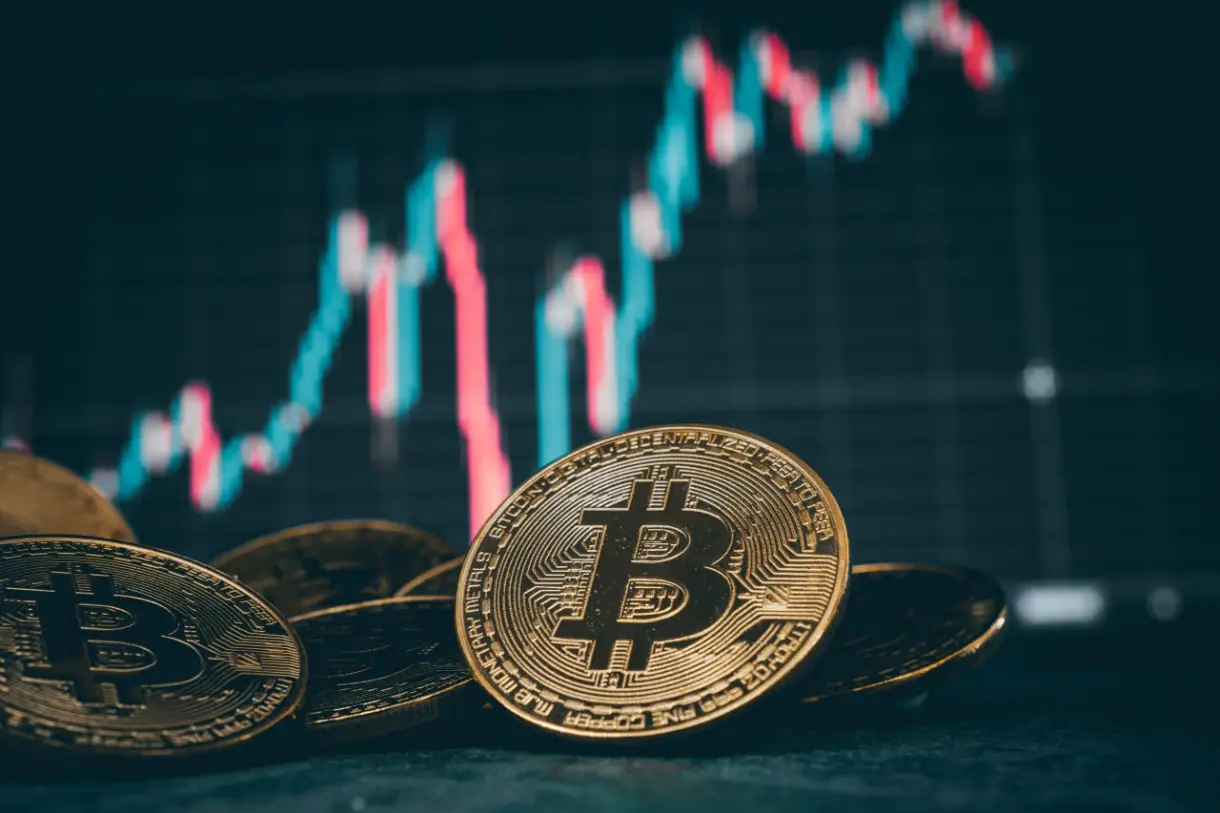
Multiple Bitcoin coins stacked in front of a bullish chart. Source: TechGaged
Bitcoin Nears a Critical Inflection Point on Multiple Charts
In Brief
- • Bitcoin is stuck in a tight range with low volatility.
- • Several charts signal an approaching inflection point.
- • A decisive move is likely soon.
Ad
Bitcoin (BTC) is approaching a familiar but uncomfortable phase of the cycle. Price action has slowed, volatility has compressed, and conviction appears split. Yet, structurally, several independent technical frameworks are converging on the same conclusion: Bitcoin is operating in a zone where major moves are typically born.
According to cryptocurrency trading expert Javon Marks, Bitcoin remains positioned in what he described as “prime areas for a bottom and another huge run within this cycle.” His thesis is based on structure, the sequence of higher-level consolidations that have repeatedly preceded expansion throughout this bull market.
Where The Pressure Is Building
Shorter-term signals echo that tension. Fellow crypto trading analyst Ali Martinez pointed out that Bitcoin was coiling inside a tightening triangle in a formation that had historically resolved with a sharp directional move. His estimate revolves around roughly 15% once a resolution occurs.
That compression is visible across timeframes. Bitcoin has struggled to reclaim key daily trend indicators, while downside attempts continue to stall before triggering broader breakdowns. This tug-of-war suggests balance, not weakness, though balance rarely lasts.
Adding another layer, pseudonymous crypto expert CoinsKid highlighted two major GCBT levels overhead, noting that BTC remains capped below the daily CoinsKid Ribbon. His roadmap allows for a potential “exit pump” toward the lower GCBT near $98,000, followed by a final local low in early 2026, possibly marking the end of the corrective C wave that began in mid-2025.
The Higher-Timeframe Signal Investors Are Watching
Zooming out, CryptoJelleNL drew attention to the monthly chart, where a potential hidden bullish divergence is forming. The condition is clear: Bitcoin must close the month above $90,360 to lock it in.
That level now carries outsized importance. A green monthly close would reinforce the idea that current weakness is corrective rather than terminal, suggesting a pause within a larger trend, not the end of it.
What This Convergence Really Means
None of these signals guarantee upside. But taken together, they describe a market that is compressing structurally, not collapsing emotionally – an important distinction.
Bitcoin usually bottoms not amid clarity but when there’s confusion, overlapping scenarios, and widespread disagreement, which is exactly the environment taking shape at the moment.
For now, the crypto market’s representative asset is changing hands at $87,501.12, recording a 0.34% decrease on the day, declining 2.66% across the week, and losing 3.53% on its monthly chart, per the latest price information.

All things considered, the charts suggest the waiting phase is nearing its end, regardless of the way the resolution will come. The longer Bitcoin remains pinned between support and resistance, the more force its eventual move is likely to carry.
More Must-Reads:
How do you rate this article?
Subscribe to our YouTube channel for crypto market insights and educational videos.


Join our Socials
Briefly, clearly and without noise – get the most important crypto news and market insights first.

Most Read Today
1
Chainlink’s 499% Social Volume Spike: Why Attention is Outpacing Price
2Cardano (ADA) Price Analysis: Quiet Accumulation as Technical Signals Begin to Strengthen
3Mantle’s $1B Milestone: Why MNT is the Next Layer 2 Powerhouse to Watch
4Zcash: The VC-Backed Rebirth of Private Finance
5Digital Silver’s Silent Strength: Litecoin (LTC) Fundamental and Technical Dive
Latest


8
Also read
Similar stories you might like.

Altcoins
Chainlink’s 499% Social Volume Spike: Why Attention is Outpacing Price
Azeez | 2026-03-15

Altcoins
The Institutional Push: Why the Aptos & Mastercard Alliance is a High-Stakes Bet for 2026
Azeez | 2026-03-14
Altcoins
The Institutional Green Light: Analyzing AVAX as Grayscale’s Staking ETF Hits Nasdaq
Azeez | 2026-03-14

Altcoins
The Pi Day Pivot: Can Polkadot’s Massive Supply Cut Fuel a DOT Breakout?
Azeez | 2026-03-14

Altcoins
Ethereum Foundation Drops New Manifesto For The Network; What’s New?
Ana | 2026-03-13

Altcoins
XRP Triangle Pattern Points To Major Upside Target
Ana | 2026-03-13

Altcoins
Whales Quietly Scoop Up Millions Of TRUMP Tokens; What’s Happening?
Rokas | 2026-03-13

Bitcoin
Supply Shock: 204K BTC Leave Exchanges As Whales Stay Dormant
Rokas | 2026-03-13

Bitcoin
Record Strategy Bitcoin Purchase Raises Supply Pressure Questions
Rokas | 2026-03-13

Bitcoin
Should You Sell Bitcoin at $100K? Here’s What ChatGPT Says
Rokas | 2026-03-12