


Bitcoin’s current market structure mirrors patterns once seen in Google’s breakout phase.
Bitcoin Draws A Surprising Parallel With Google
In Brief
- • Bitcoin’s consolidation is being compared to Alphabet’s past breakout structure.
- • The focus is on market behavior, not price targets.
- • The comparison points to patience during prolonged consolidation.
Ad
Bitcoin (BTC)’s recent consolidation phase is drawing comparisons beyond the cryptocurrency industry as a chart shared by a renowned crypto analyst suggests Bitcoin’s structure may be echoing a familiar path once traced by Alphabet, Google’s parent company.
Indeed, the context and side-by-side comparison shared by crypto trading expert Ali Martinez in an X post on February 3 suggests that mature assets and Bitcoin may now follow similar growth arcs.
What The Chart Comparison Shows
The comparison shows Bitcoin’s current price structure against Alphabet’s historical breakout phase. In Google’s case, a long period of choppy consolidation eventually gave way to a strong trend expansion.
According to Martinez, Bitcoin appears to be tracing a similar rhythm, including an extended base, volatility compression, and a gradual transition from distribution into directional movement. The chart doesn’t argue that price levels must match, but that market behavior might.
Fractal comparisons like this focus on structure rather than timing. They look at how price reacts to support, how pullbacks behave, and whether momentum builds progressively rather than explosively.
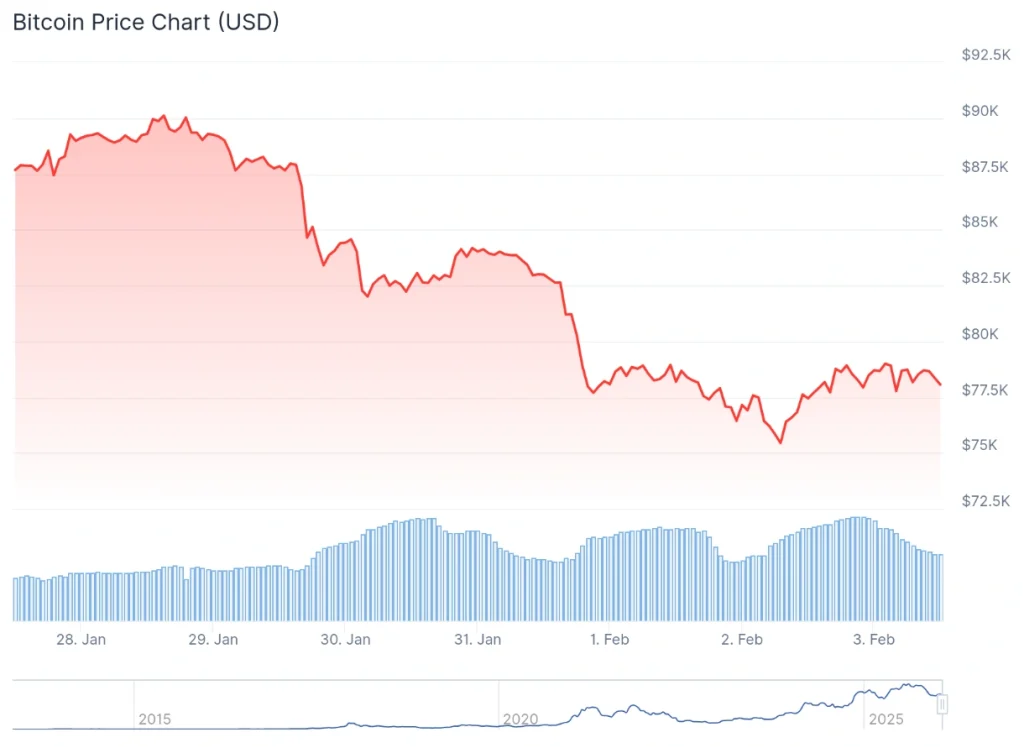
Meanwhile, BTC is trading at $78,026.35, which represents a 0.7% increase on the day, despite losing 11% across the week, and dipping 14.8% over the past month, per the latest price chart information.
Why This Comparison Resonates With Markets
As Bitcoin matures, comparisons to large-cap equities are becoming more common. Institutional participation, exchange-traded fund (ETF) flows, and longer holding periods have pushed Bitcoin closer to assets that trade on multi-year narratives rather than short hype cycles.
Alphabet’s historical move unfolded during a period when fundamentals steadily improved while price lagged expectations, until it didn’t. The lag-then-expand dynamic is what makes the comparison compelling to some analysts.
Still, this isn’t a forecast. Fractals fail as often as they succeed, especially when macro conditions shift. Interest rates, liquidity, and regulation matter far more than chart symmetry alone.
What the comparison does offer is perspective. If Bitcoin is following a playbook seen in other large assets, it may suggest patience and a reminder that some of the most powerful moves arrive after long stretches of boredom.
Bitcoin Price Today
More Must-Reads:
How do you rate this article?
Subscribe to our YouTube channel for crypto market insights and educational videos.


Join our Socials
Briefly, clearly and without noise – get the most important crypto news and market insights first.
Most Read Today
1
Crypto Trading Volume Collapse: March on Track for Worst Month Since 2020
2SEC Move Opens New Phase For Bitcoin And Ethereum ETFs
3Bitcoin Crash Fears Return as Market Pressure Builds
4A Healthy Pullback Or Something More — What Drove Crypto Markets This Week
5New Threat to Prediction Markets as U.S. Crackdown Expands
Latest


8
Also read
Similar stories you might like.

Altcoins
Cardano Traders Are Capitulating — A Turning Point or Warning Sign?
Ana | 2026-03-24

Altcoins
XRP May Be Entering a Key Phase as Market Stress Signals Are Building
Ana | 2026-03-24

Market
Exclusive: AI Finance Is Now “Institutional Grade”, Says True Trading Co-Founder Igor Stadnyk
Sead | 2026-03-24

Altcoins
XRP Ownership Patterns Are Changing — And It May Signal Something Bigger
Ana | 2026-03-24

Bitcoin
Wall Street Behavior Suggests a Turning Point for Bitcoin Strategy Firms
Rokas | 2026-03-24

Altcoins
Ethereum Supply Concentration Is Rising — A Quiet Shift Is Underway
Rokas | 2026-03-24

Market
A Healthy Pullback Or Something More — What Drove Crypto Markets This Week
Sead | 2026-03-23

Bitcoin
Bitcoin Supply Shift Raises New Questions Across Market
Ana | 2026-03-23
Market
Crypto Trading Volume Collapse: March on Track for Worst Month Since 2020
Jastra | 2026-03-23

Industry
U.S. Crypto Regulation Breakthrough Pushes Clarity Act Closer to Reality
Ana | 2026-03-23