


Bitcoin coin frozen in ice. Source: TechGaged / Shutterstock
Bitcoin Consolidation Continues as Market Signals Rising Volatility; What’s Next?
In Brief
- • Bitcoin remains range-bound with key breakout levels in focus.
- • Extreme fear signals rising volatility risk.
- • A move outside the range could trigger the next trend.
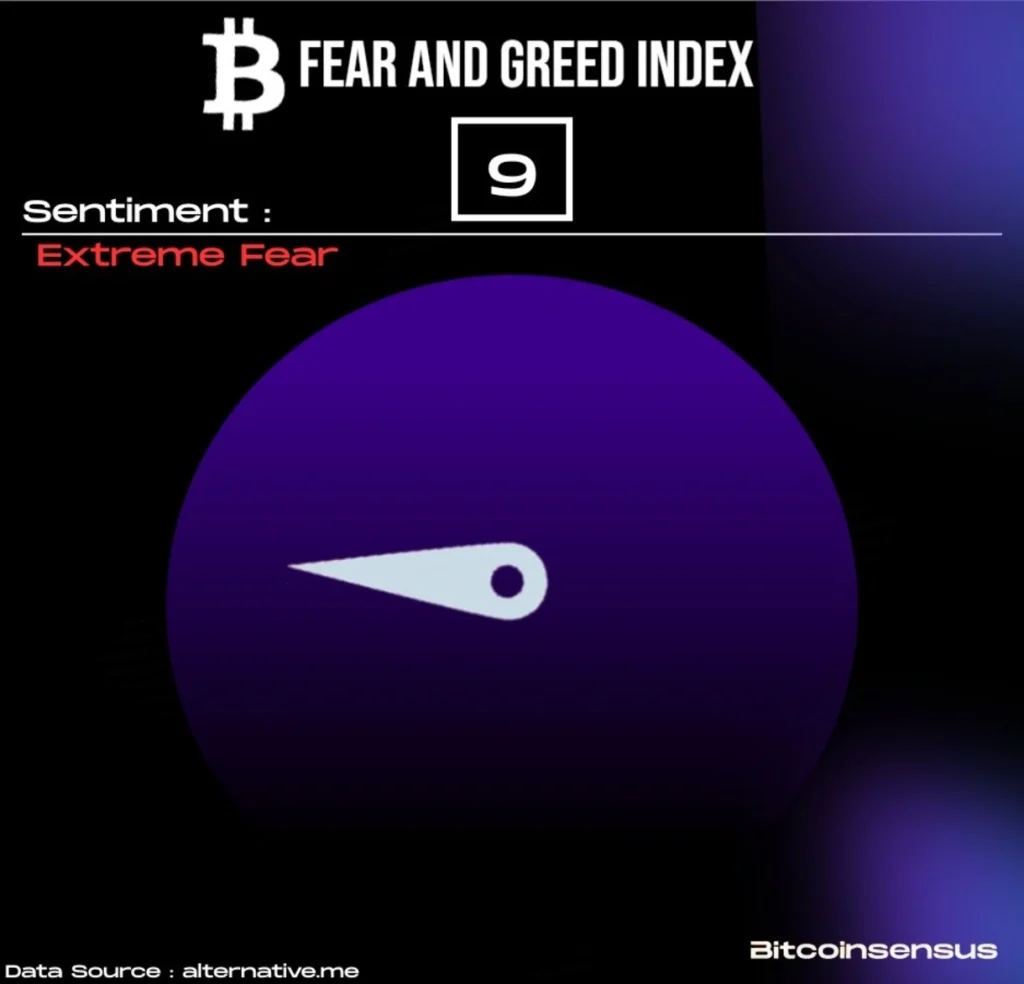
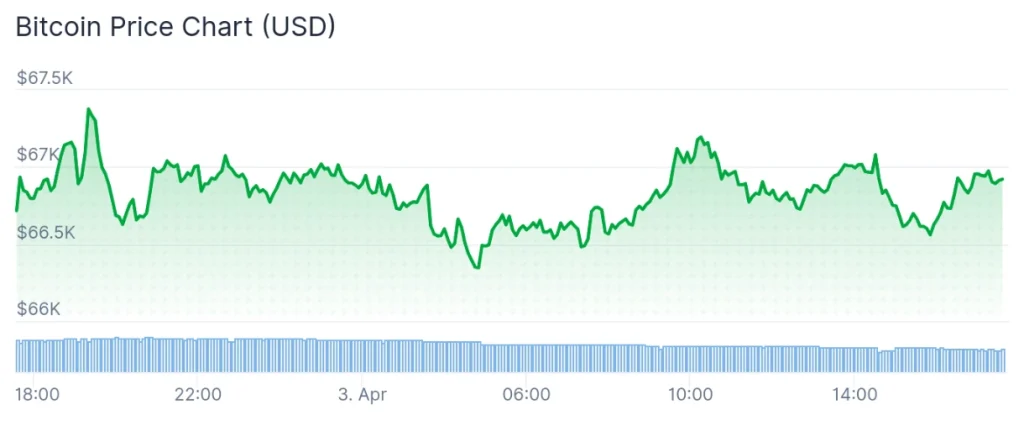
Bitcoin (BTC) is trading around $66K with no clear direction as price remains stuck in a tight range. Market sentiment has dropped into extreme fear, with the Fear and Greed Index printing just 9. The longer this consolidation lasts, the more traders expect a sharp move once key levels break.
Key levels tighten as liquidity builds
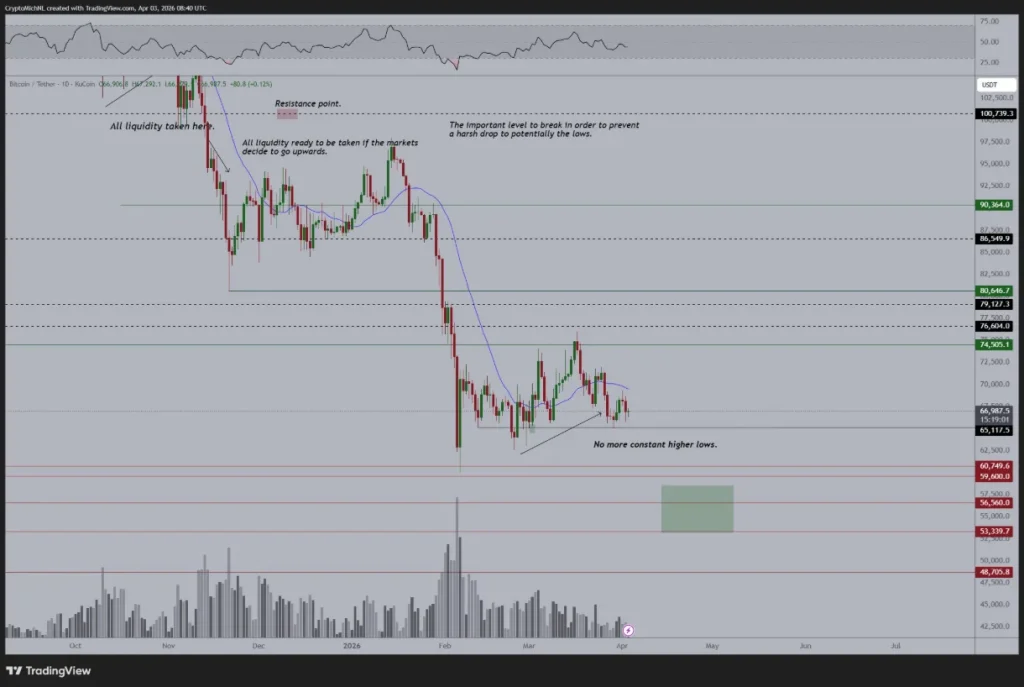
According to the analysis shared by prominent crypto market expert Michaël van de Poppe in an X post on April 3, Bitcoin has been “stagnant” in the current range, with no trend forming on either side.
He points to $71,000 as the level that needs to break for upside continuation. Until then, price remains compressed. At the same time, liquidity is stacking both above and below.
Meanwhile, fellow crypto trading analyst Ali Martinez highlights three major zones where positions are likely to get cleared. Resistance sits around $70,400 and $73,400, while a deeper liquidity pocket remains near $55,000.
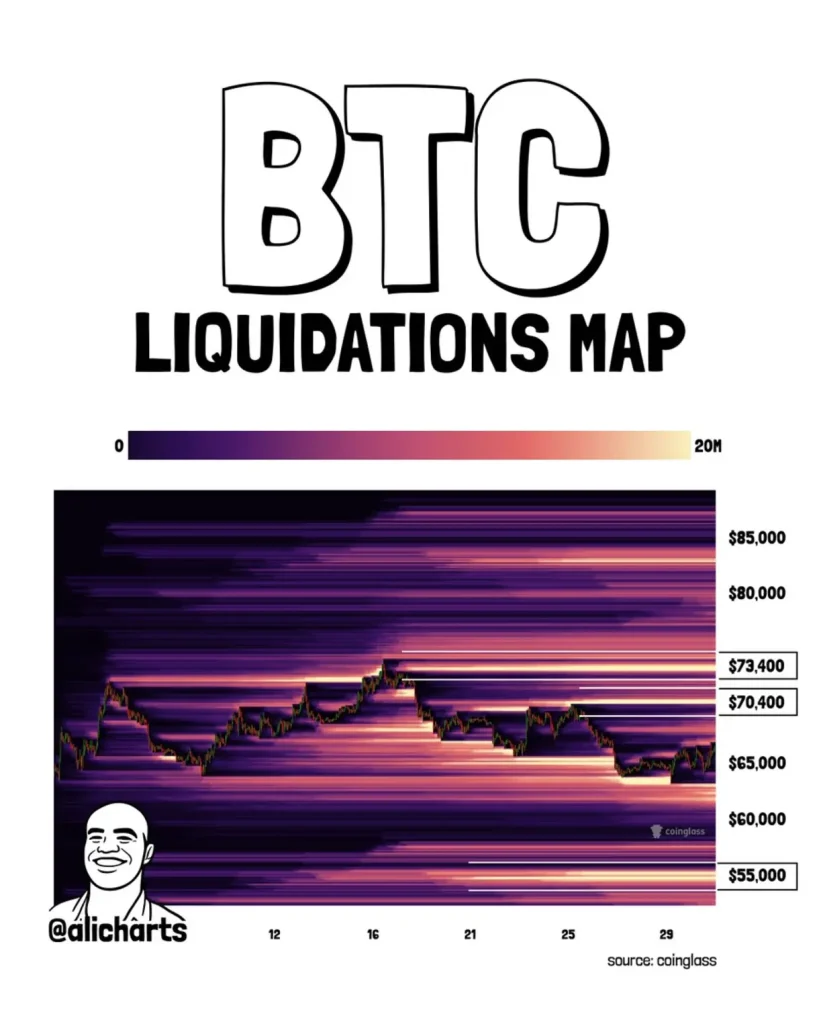
If upside levels fail to break, the downside becomes the next target.
Sentiment collapses as structure weakens
The broader market mood has shifted sharply. The Fear and Greed Index dropping to 9 puts sentiment deep into panic territory, a level historically seen during major corrections.
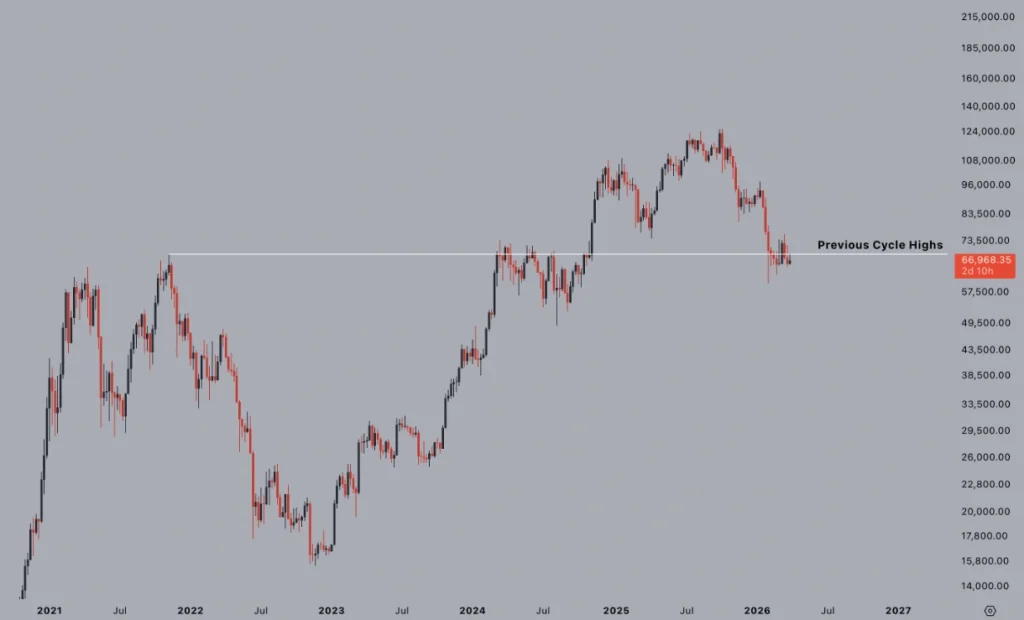
At the same time, structure is starting to crack. Pseudonymous crypto specialist CryptoJelleNL notes that Bitcoin has lost the previous cycle high level and failed to reclaim it. That turns a key support into resistance, which often signals continued downside pressure.
He points to a possible move toward the mid-$50,000 range if current levels don’t hold.
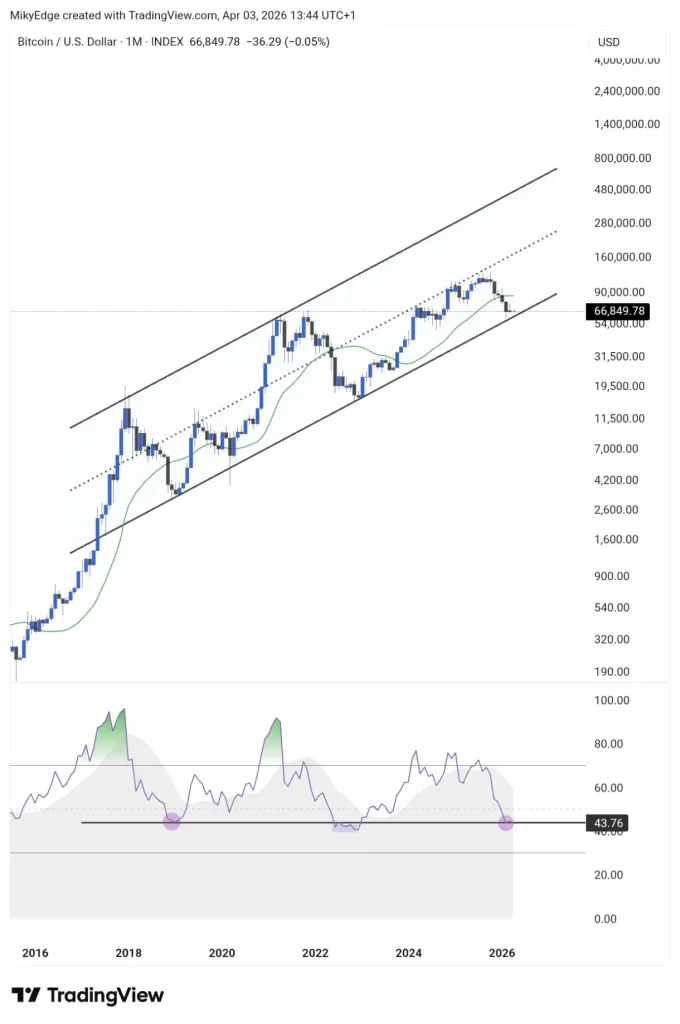
Another chart, shared by analyst MikyBull Crypto, suggests Bitcoin is approaching zones where bottoms have formed in past cycles, but there is no confirmation yet.
For now, the market is waiting, with Bitcoin changing hands at the price of $66,918.90, which indicates an increase of 0.3% in the last 24 hours, a 1.1% gain across the past seven days, but a 6.7% drop over the month, according to the latest chart information.
A break above $71K shifts momentum upward. A rejection keeps the focus on lower liquidity zones, where the next real test sits.
Factors that could push the price into this area may include wider institutional acceptance of the original crypto asset, increased spot Bitcoin exchange-traded fund (ETF) demand, further development of Bitcoin’s utility beyond store of value, and favorable macroeconomic and regulatory climate.
On the other hand, fears that quantum computing advances will endanger Bitcoin security, the expiry of a staggering $1.8 billion Bitcoin options contracts, and other negatively perceived developments could trigger further downside, and challenge the upside potential.
How do you rate this article?
Subscribe to our YouTube channel for crypto market insights and educational videos.


Join our Socials
Briefly, clearly and without noise – get the most important crypto news and market insights first.
Most Read Today
1
How Accurate Are Robert Kiyosaki’s Predictions?
2TAO Subnet Reality Check: Revenue vs. Subsidies – What Investors Must Know After the Rally
3This Wall Street Giant Bought Crypto Firm Despite Market Slump
4RenderCon 2026 Preview: What the Upcoming Event Means for RENDER Price and Adoption
5Ripple’s Brokerage Arm Lands Investment-Grade Rating as Expansion Continues
Latest


8
Also read
Similar stories you might like.

Industry
Two More U.S. States Grant DAOs Legal Recognition
Ana | 2026-04-03

Defi
Coinbase Lands OCC Approval in Major U.S. Crypto Shift
Ana | 2026-04-03

Defi
CFTC Sues Arizona, Illinois, Connecticut for Blocking Prediction Markets
Rokas | 2026-04-03

Defi
Ripple’s Brokerage Arm Lands Investment-Grade Rating as Expansion Continues
Rokas | 2026-04-03

Altcoins
NEAR Horizon: Is the Ecosystem Ready for the Next Wave of Mass Adoption?
Azeez | 2026-04-03

Defi
Major EU Bank CaixaBank Moves Into Crypto Under MiCA
Ana | 2026-04-02

Blockchain
Solana-Based Drift Protocol Halts Operations After Security Breach; What Happened?
Ana | 2026-04-02

Defi
This Wall Street Giant Bought Crypto Firm Despite Market Slump
Rokas | 2026-04-02

Defi
Ripple Launches System Letting Firms Manage Crypto Like Cash
Rokas | 2026-04-02

Altcoins
TAO Subnet Reality Check: Revenue vs. Subsidies – What Investors Must Know After the Rally
Azeez | 2026-04-02