


Hand holding Bitcoin coin before chart. Source: TechGaged / Shutterstock
Bitcoin Channel Model Suggests $170K–$600K Upside
In Brief
- • Bitcoin still trades within a nine-year rising channel.
- • Key structural support sits near the $60K area.
- • Model outlines a possible $170K–$600K expansion zone.
Ad
Bitcoin (BTC)’s long-term market structure may still be intact despite recent volatility. According to a recent analysis, Bitcoin continues to trade within a nine-year ‘base channel’ model that has guided price movements since 2017. The analysis suggests Bitcoin could be approaching a historically important support area near $60K. Similar touches of the channel base were followed by strong upward moves in previous cycles.
Bitcoin’s Nine-Year Trend Structure
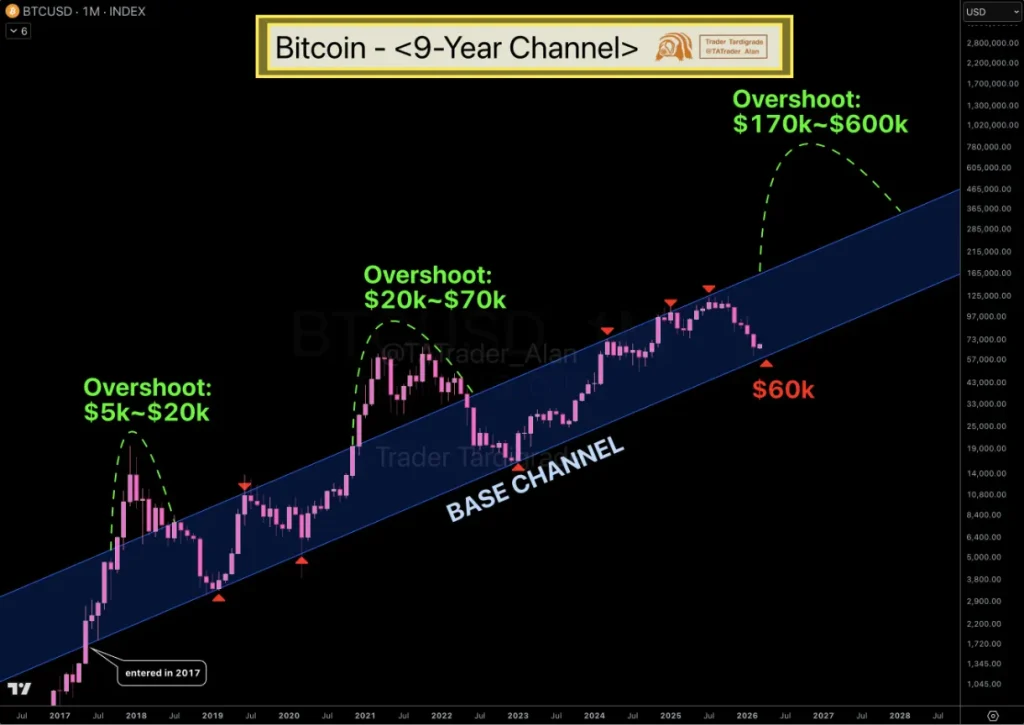
Notably, a chart shared by prominent cryptocurrency trading expert Trader Tardigrade in an X post on March 4 highlights a rising channel that has framed Bitcoin’s long-term price action for nearly a decade. Since entering this structure in 2017, BTC has repeatedly bounced between the channel’s lower and upper boundaries.
During prior bull cycles, Bitcoin temporarily moved above the upper boundary of the channel before correcting back into the structure. These moves are labeled as “overshoots” in the chart.
The first overshoot occurred during the 2017 bull market, when Bitcoin surged from roughly $5,000 to around $20,000. The second happened in the 2021 cycle, when BTC climbed from the $20,000 region to roughly $70,000 before retracing.
According to the chart’s framework, these overshoot phases tend to occur after price rebounds from the lower portion of the channel.
Why The $60K Zone Matters
The chart’s setup shows Bitcoin approaching the bottom of the channel, which sits near the $60,000 area. Historically, this zone has acted as a structural support level where buyers often step in.
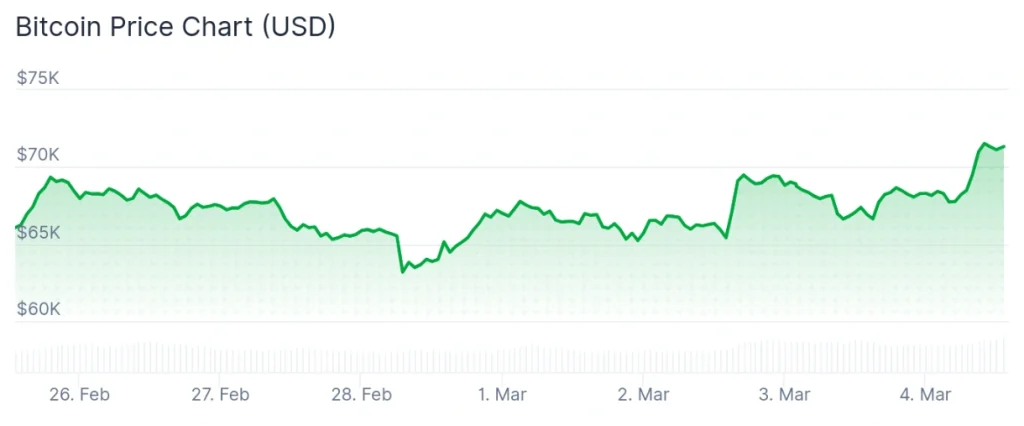
Since then, BTC has improved and is currently trading at the price of $71,368.32, up 6.3% on the day and advancing 8% across the past week, as it brings down to 8.4% the losses accumulated over the month, according to the most recent chart information.
The next major move seems to have already started and is pushing Bitcoin above the channel again. The chart outlines a potential overshoot zone between roughly $170,000 and $600,000 during a future expansion phase.
Such projections should be viewed cautiously, as long-term models rely on historical patterns rather than guaranteed outcomes. Factors like market conditions and institutional demand can influence how closely the price follows technical structures.
For now, Bitcoin’s multi-year trend channel remains intact. As long as BTC continues to respect this long-term structure, analysts say the broader bullish framework could remain in place.
More Must-Reads:
How do you rate this article?
Subscribe to our YouTube channel for crypto market insights and educational videos.


Join our Socials
Briefly, clearly and without noise – get the most important crypto news and market insights first.
Most Read Today
1
Here’s What Crypto Whales Are Hoarding In March
2Ethereum Eyes BitTorrent-Style Block Building; Here’s What It Brings
3This Crypto Exchange Has Blocked 3 Million User Account Hijacks
4Bitcoin Miner Dumps Entire BTC Reserve To Fund AI Push
5‘Rich Dad’ R. Kiyosaki Says Bitcoin Next After Gold’s Jump
Latest


8
Also read
Similar stories you might like.

Blockchain
Trump Pushes Crypto Bills, Says Banks Are Undermining Progress
Ana | 2026-03-04

Altcoins
Altseason Talk Online Hits Lows Historically Linked To Crypto Rallies
Rokas | 2026-03-04

Altcoins
Cardano Whale Activity Spikes As 230M Tokens Shift
Rokas | 2026-03-04

Altcoins
Analyst Forecasts Multi-Year Crypto Expansion Within Eight Months
Ana | 2026-03-04

Bitcoin
‘Rich Dad’ R. Kiyosaki Says Bitcoin Next After Gold’s Jump
Ana | 2026-03-03

Altcoins
XRP Stay-To-Earn Program Goes Live With 50K Token Pool
Ana | 2026-03-03

Blockchain
This Crypto Exchange Has Blocked 3 Million User Account Hijacks
Ana | 2026-03-03

Bitcoin
Bitcoin Miner Dumps Entire BTC Reserve To Fund AI Push
Ana | 2026-03-03
Altcoins
Here’s What Crypto Whales Are Hoarding In March
Ana | 2026-03-03

Altcoins
These 7 Altcoins Posted Double-Digit Gains Last Week — Is Altcoin Season Brewing?
Rokas | 2026-03-02