


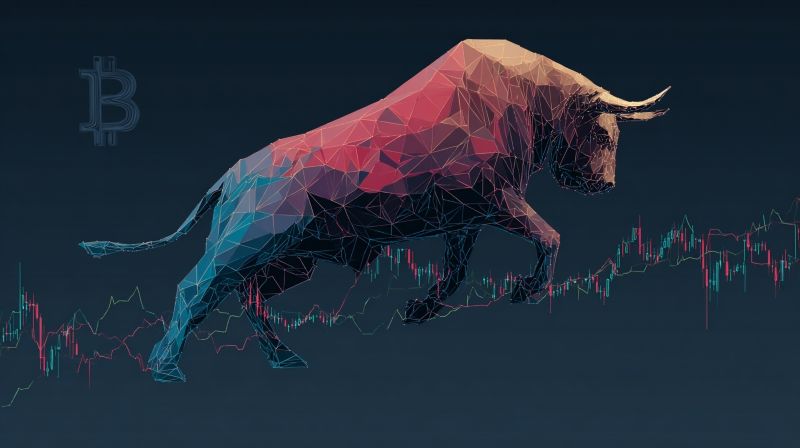
Bullish divergence sparks hope for BTC recovery

Amid a bit of a bear market that has shaken the majority of cryptocurrencies, Bitcoin (BTC) is flashing a strong bullish divergence signal, suggesting a possible reversal is in progress after weeks of consolidation and selling pressure.
Specifically, Bitcoin has witnessed divergence between its price action and momentum indicators, and crypto trading expert Javon Marks has noted that while BTC made lower lows in price, both the Relative Strength Index (RSI) and On-Balance Volume (OBV) printed higher lows in his X post on October 22.

As it happens, this divergence, which BTC has demonstrated on its latest 4-hour chart, is a classic sign that bearish momentum is fading and that “reversal looks to be in progress,” in Marks’ words.
Key indicators align for an upward shift
Indeed, the chart shows a clean divergence setup, including a downward slope with fresh local lows in terms of price trend, OBV rising, indicating accumulation despite price weakness, and RSI recovering off oversold levels, signaling improving buying pressure.
This type of structure often precedes a trend reversal, as it reflects growing strength beneath the surface even when the broader market appears weak. In short, sellers are losing control, and smart money may be positioning for the next leg up.
For the time being, BTC is trading at $108,262.83, having rebounded from its local bottom around $107,000, which indicates an increase of 0.52% in the last 24 hours, against the backdrop of a 4.45% dip across the previous seven days and an accumulated decline of 4.04% on its monthly chart, per the latest data.

If the divergence confirms with a sustained move above $114,000 – $115,000, a continuation toward higher highs may occur, potentially aligning with the broader uptrend structure seen in Bitcoin’s higher timeframes, even as short-term charts, like the CME gap, point to a pullback.
How do you rate this article?
Subscribe to our YouTube channel for crypto market insights and educational videos.


Join our Socials
Briefly, clearly and without noise – get the most important crypto news and market insights first.

Most Read Today
1
Whales Bought 10 Million Cardano (ADA) in 3 Days — Smart Money Positioning Early?
2Exclusive: Dr. Persichetti Challenges Key Claims in Cointelegraph’s Quantum Crypto Analysis
3Dogecoin Awakens After Seventy-Three Days as SpaceX Eyes June IPO
4Robert Kiyosaki Predicts 2026 Crash, Says Assets Will Go Cheap
5The 3 Hidden Catalysts Deciding the Bitcoin vs. Gold Winner This Month
Latest


8
Also read
Similar stories you might like.

Bitcoin
America’s Debt Now Exceeds GDP — Is This the Silent Catalyst Bitcoin Was Waiting For?
Azeez | 2026-05-03

Altcoins
Beyond Price: Accenture’s Hedera Move Could Redefine Enterprise Crypto in 2026
Azeez | 2026-05-03
Altcoins
Ripple Re-Locks 700M XRP Amid CLARITY Act Progress — Preparing for a Regulated Future?
Azeez | 2026-05-03
Altcoins
Whale Watch: Smart Money Is Silently Accumulating These Altcoins
Azeez | 2026-05-02
Altcoins
Bitcoin Cash (BCH) May 15 Upgrade: Can CashVM Actually Steal Ethereum’s DeFi Crown?
Azeez | 2026-05-02

Altcoins
Zcash (ZEC) Soars as Privacy Flywheel Locks In On-Chain Growth
Azeez | 2026-05-02

Altcoins
Hyperliquid vs. Solana: Which Layer-1 Will Dominate the May Derivatives Surge?
Azeez | 2026-05-02

Bitcoin
The 3 Hidden Catalysts Deciding the Bitcoin vs. Gold Winner This Month
Azeez | 2026-05-01

Altcoins
Dogecoin Awakens After Seventy-Three Days as SpaceX Eyes June IPO
Azeez | 2026-05-01

Altcoins
Whales Bought 10 Million Cardano (ADA) in 3 Days — Smart Money Positioning Early?
Azeez | 2026-05-01