


Bitcoin’s hidden bullish divergence could shock the bears

Although things in the cryptocurrency market are looking anything but bullish, Bitcoin (BTC) has demonstrated a hidden bullish divergence indicator that could shock the bears and turn the tide for the flagship decentralized finance (DeFi) asset.
Indeed, Bitcoin may be gearing up for its next major move after confirming a hidden bullish divergence on the weekly timeframe, which is visible on both the price action and the relative strength index (RSI), according to an analysis by popular crypto analyst Matthew Hyland on September 15.

Specifically, the weekly BTC/USD chart shows that, despite recent consolidation in the $110,000 – $120,000 range, the original crypto asset has continued to hold higher lows in price. Meanwhile, the RSI – a key momentum oscillator – formed a series of lower lows during the same period.
Why the hidden bullish divergence matters
This discrepancy between the indicator and the actual price trend is what traders describe as a hidden bullish divergence. Unlike regular bullish divergence, which often points to a potential reversal, hidden bullish divergence is generally seen as a continuation pattern, indicating that the prevailing uptrend is likely to resume.
At the same time, Bitcoin’s position in the broader cycle amplifies the significance of this setup. Following a strong run-up earlier this year, BTC entered a cooling-off phase, but buyers repeatedly defended key support levels. By confirming the divergence on the weekly timeframe, Bitcoin may be signaling renewed strength ahead.
Historically, such divergences have preceded substantial price expansions. Analysts point out that when momentum indicators lag while price holds or trends upward, it often means that sellers are losing control despite short-term pressure. In this case, BTC maintaining support above the $110,000 zone reinforces bullish structure.
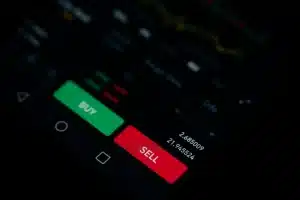
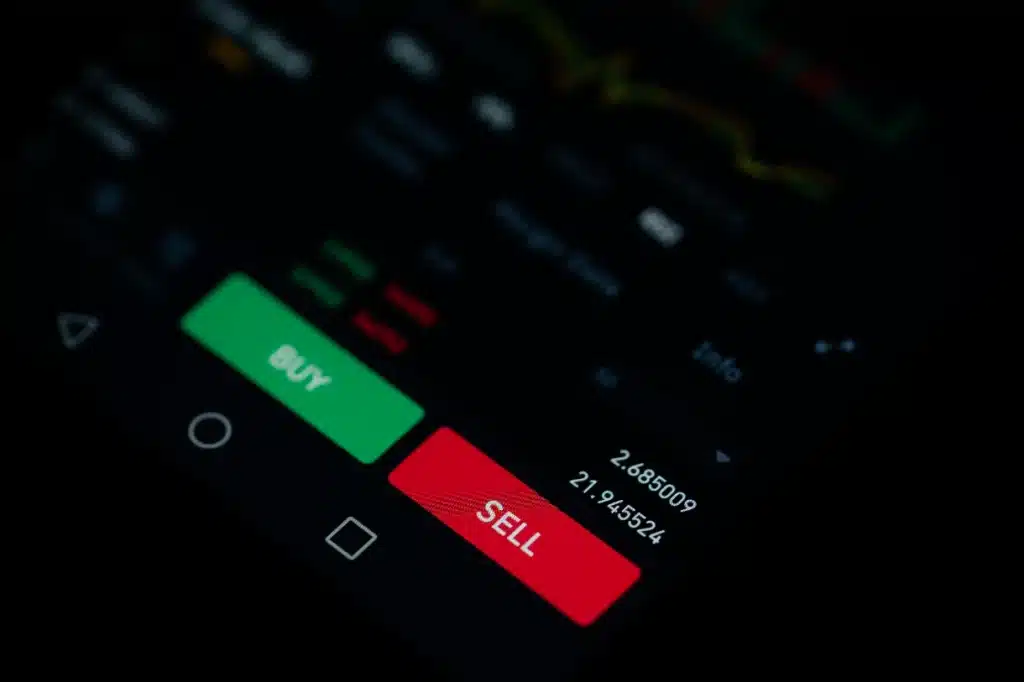
Currently, Bitcoin is changing hands at the price of $115,069.93, which suggests a decline of 0.81% in the last 24 hours, a gain of 2.83% across the previous seven days, and a 2.13% drop on its monthly chart, according to the latest data.

Overall, the hidden bullish divergence adds weight to the argument that Bitcoin’s bull market is intact. If the pattern plays out as expected, BTC could be on the verge of its next leg higher, potentially shocking skeptics who anticipated a deeper correction.
How do you rate this article?
Subscribe to our YouTube channel for crypto market insights and educational videos.


Join our Socials
Briefly, clearly and without noise – get the most important crypto news and market insights first.

Most Read Today
1
Whales Bought 10 Million Cardano (ADA) in 3 Days — Smart Money Positioning Early?
2Exclusive: Dr. Persichetti Challenges Key Claims in Cointelegraph’s Quantum Crypto Analysis
3Dogecoin Awakens After Seventy-Three Days as SpaceX Eyes June IPO
4Robert Kiyosaki Predicts 2026 Crash, Says Assets Will Go Cheap
5The 3 Hidden Catalysts Deciding the Bitcoin vs. Gold Winner This Month
Latest


8
Also read
Similar stories you might like.

Bitcoin
America’s Debt Now Exceeds GDP — Is This the Silent Catalyst Bitcoin Was Waiting For?
Azeez | 2026-05-03

Altcoins
Beyond Price: Accenture’s Hedera Move Could Redefine Enterprise Crypto in 2026
Azeez | 2026-05-03

Altcoins
Ripple Re-Locks 700M XRP Amid CLARITY Act Progress — Preparing for a Regulated Future?
Azeez | 2026-05-03
Altcoins
Whale Watch: Smart Money Is Silently Accumulating These Altcoins
Azeez | 2026-05-02

Altcoins
Bitcoin Cash (BCH) May 15 Upgrade: Can CashVM Actually Steal Ethereum’s DeFi Crown?
Azeez | 2026-05-02

Altcoins
Zcash (ZEC) Soars as Privacy Flywheel Locks In On-Chain Growth
Azeez | 2026-05-02

Altcoins
Hyperliquid vs. Solana: Which Layer-1 Will Dominate the May Derivatives Surge?
Azeez | 2026-05-02

Bitcoin
The 3 Hidden Catalysts Deciding the Bitcoin vs. Gold Winner This Month
Azeez | 2026-05-01

Altcoins
Dogecoin Awakens After Seventy-Three Days as SpaceX Eyes June IPO
Azeez | 2026-05-01

Altcoins
Whales Bought 10 Million Cardano (ADA) in 3 Days — Smart Money Positioning Early?
Azeez | 2026-05-01