


Technicals hint Bitcoin could find bottom at $70K

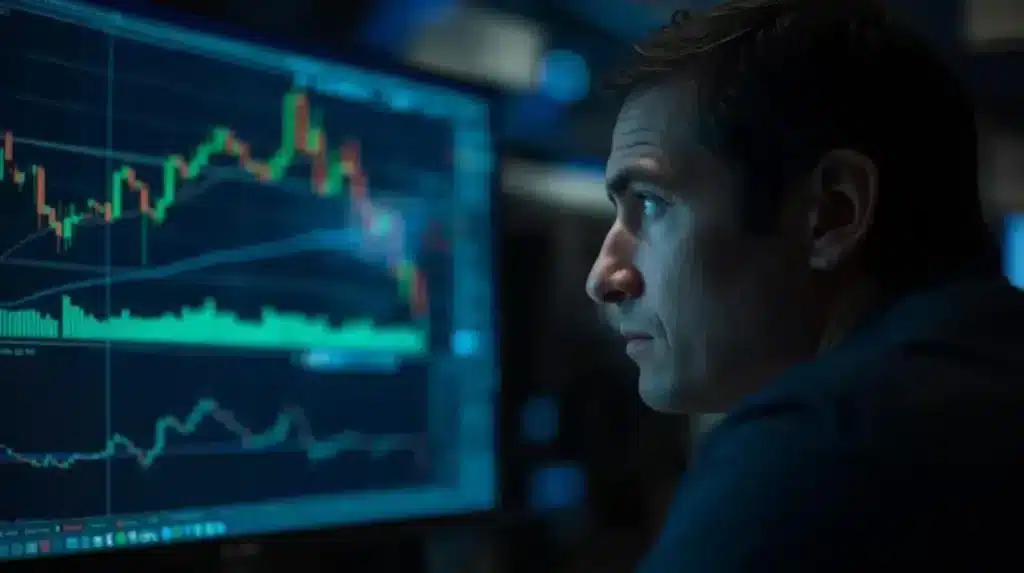
As the major part of the cryptocurrency market continues to witness declines, Bitcoin (BTC) is no exception, and things might first need to go worse for the flagship decentralized finance (DeFi) asset before it can start its recovery towards new all-time highs (ATHs).
Indeed, Bitcoin’s recent pullback has moved analysts to eye key technical levels that could define the next phase of its price action, and professional crypto trader Ali Martinez has identified three major support zones to emerge: $112,800, $91,400, and $70,000, per his X post on August 20.

Which technicals are important?
As it happens, his insights come from MVRV pricing bands, a popular valuation model that compares Bitcoin’s market value to its realized value. At present, they suggest that Bitcoin could stabilize within this wide range, with $70,000 standing out as a potential ultimate floor if bearish pressure intensifies.
Meanwhile, the weekly Relative Strength Index (RSI) has been printing lower highs for Bitcoin since March 2024, pointing to a gradual loss of bullish strength that often precedes a major market decision – either a breakdown toward lower supports or a reversal once buyers regain control.

That said, the $112,000 level is attracting particular attention among traders like Martinez, who noted that “all eyes” are on this price as the line in the sand that could determine whether Bitcoin resumes its uptrend or slides deeper into correction territory.
For the time being, the maiden crypto asset is changing hands at the price of $113,532.12, which indicates a decline of 1.82% in the last 24 hours, adding up to the 5.65% drop across the previous seven days and a 3.76% dip on its monthly chart, according to the latest data.

All things considered, the crypto community is eagerly awaiting Bitcoin’s next moves, weighing whether this is the beginning of a deeper correction or the last major dip before another rally, possibly even to a new all-time high (ATH), earlier halted by the surprise inflation data.
How do you rate this article?
Subscribe to our YouTube channel for crypto market insights and educational videos.


Join our Socials
Briefly, clearly and without noise – get the most important crypto news and market insights first.

Most Read Today
1
Whales Bought 10 Million Cardano (ADA) in 3 Days — Smart Money Positioning Early?
2Exclusive: Dr. Persichetti Challenges Key Claims in Cointelegraph’s Quantum Crypto Analysis
3Dogecoin Awakens After Seventy-Three Days as SpaceX Eyes June IPO
4Robert Kiyosaki Predicts 2026 Crash, Says Assets Will Go Cheap
5The 3 Hidden Catalysts Deciding the Bitcoin vs. Gold Winner This Month
Latest


8
Also read
Similar stories you might like.

Bitcoin
America’s Debt Now Exceeds GDP — Is This the Silent Catalyst Bitcoin Was Waiting For?
Azeez | 2026-05-03

Altcoins
Beyond Price: Accenture’s Hedera Move Could Redefine Enterprise Crypto in 2026
Azeez | 2026-05-03
Altcoins
Ripple Re-Locks 700M XRP Amid CLARITY Act Progress — Preparing for a Regulated Future?
Azeez | 2026-05-03
Altcoins
Whale Watch: Smart Money Is Silently Accumulating These Altcoins
Azeez | 2026-05-02
Altcoins
Bitcoin Cash (BCH) May 15 Upgrade: Can CashVM Actually Steal Ethereum’s DeFi Crown?
Azeez | 2026-05-02

Altcoins
Zcash (ZEC) Soars as Privacy Flywheel Locks In On-Chain Growth
Azeez | 2026-05-02
Altcoins
Hyperliquid vs. Solana: Which Layer-1 Will Dominate the May Derivatives Surge?
Azeez | 2026-05-02

Bitcoin
The 3 Hidden Catalysts Deciding the Bitcoin vs. Gold Winner This Month
Azeez | 2026-05-01

Altcoins
Dogecoin Awakens After Seventy-Three Days as SpaceX Eyes June IPO
Azeez | 2026-05-01

Altcoins
Whales Bought 10 Million Cardano (ADA) in 3 Days — Smart Money Positioning Early?
Azeez | 2026-05-01