


Financial market candlestick chart showing an upward price trend. Source: TechGaged / Shutterstock.
Hedera’s native token HBAR is quietly gaining institutional traction. In March 2026, the HBAR ETF recorded +$2.12 million in net inflows, securing a top-5 ranking among altcoin ETFs and extending a streak of positive monthly flows since launch in late 2025.
Cumulative inflows now exceed $94 million, signaling steady smart-money accumulation even as broader altcoin sentiment remains cautious.
Are HBAR ETFs the Stealth Catalyst Institutions Have Been Waiting For?
Unlike many altcoin ETFs that have seen volatile or negative flows, HBAR products have delivered consistent net inflows every month.
March’s report placed it ahead of several higher-profile names, underscoring growing confidence in Hedera’s enterprise-grade network.
On-chain analyst Crypto Patel recently highlighted on X that the US spot crypto ETFs March 2026 report showed HBAR ETF inflows of $2.12 million, equivalent to 21.83 million HBAR.
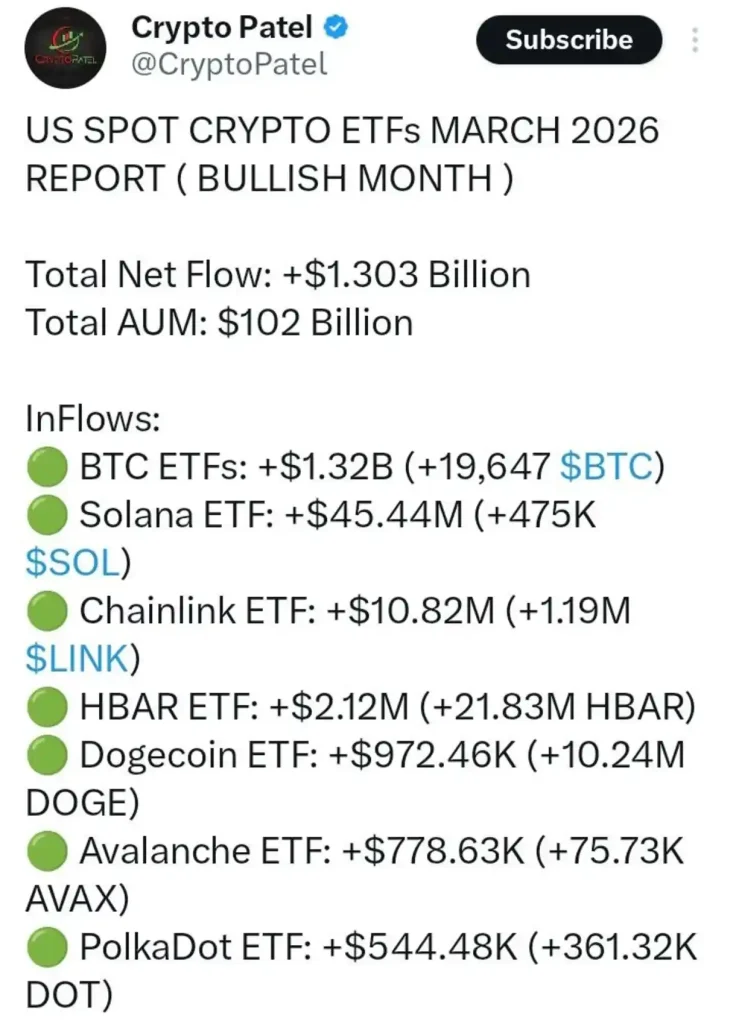
This persistent buying pressure from regulated vehicles provides a structural bid that many mid-cap tokens lack.
HBAR’s Weekly Technical Outlook: Signs of a Potential Turnaround
The Hedera (HBAR) USD weekly chart, captured at 15:11 UTC on April 5, 2026, shows price at $0.086 after a modest 0.68% decline.
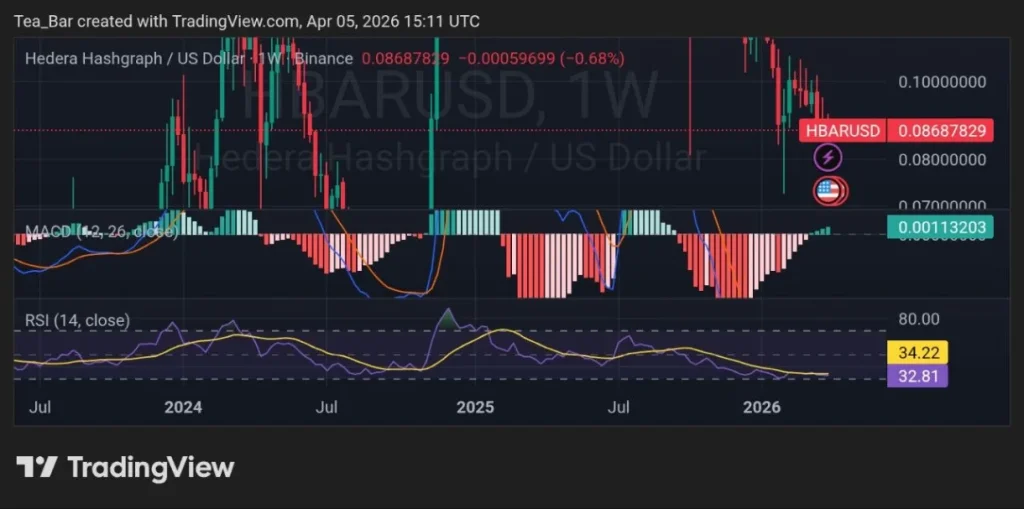
MACD (12, 26, close) prints a positive histogram at +0.00113203, signaling underlying momentum is beginning to build, while the RSI (14) sits at 34.22 — firmly in oversold territory and pointing to possible relief upside.
This setup suggests that bearish pressure may be fading as buyers gradually step in at lower levels.
The HBAR/BTC weekly pair is trading at 0.00000130BTC, remaining flat on the week as of 15:12 UTC.
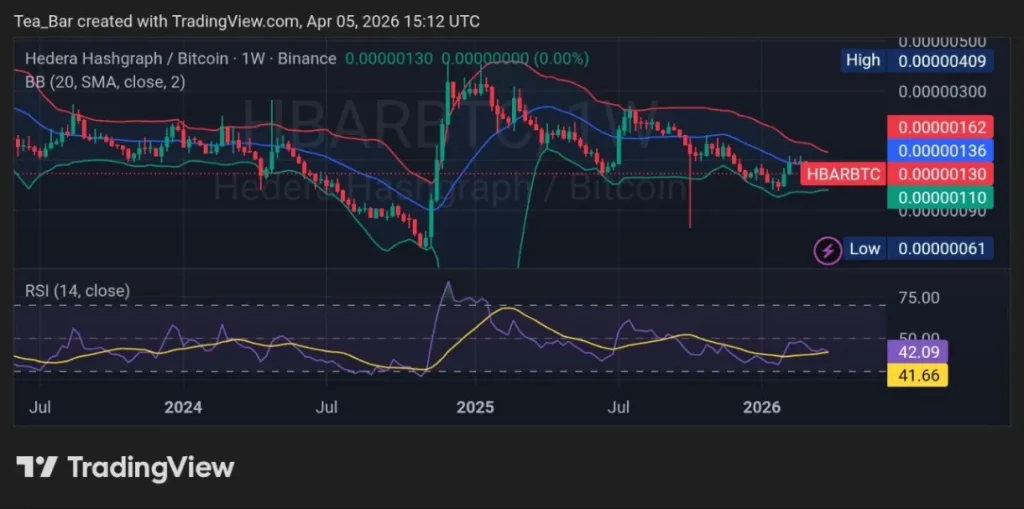
Bollinger Bands (20, SMA, close, 2) are tightening after a prior expansion phase, while the RSI (14) stands at 42.09 — neutral but showing early signs of stabilization.
Altogether, these indicators point to a consolidation phase with improving relative strength against Bitcoin, potentially setting the stage for a breakout if broader market flows turn favorable.
On-Chain Metrics Reveal Enterprise Resilience
Recent data from the official Hedera Explorer and Messari, gathered at 14:55 UTC on April 5, 2026, confirm sustained network health. Daily transactions average 45–55 million, with over 1.2 million active accounts in the past 30 days.
Total staked HBAR exceeds 18 billion tokens, reflecting strong long-term holder conviction.
Enterprise adoption remains a standout feature, with Hedera processing real-world asset and supply-chain volume that continues to grow even during broader market consolidation.
Will Steady ETF Inflows Finally Trigger HBAR’s Long-Awaited Breakout?
The technical base is showing early signs of stabilization, on-chain activity remains robust, and institutional ETF flows provide a reliable tailwind.
With MACD turning constructive and RSI approaching oversold levels, HBAR appears coiled for expansion — provided broader market sentiment cooperates.
The charts reflect consolidation with bullish undertones, the data confirms genuine enterprise utility, and the ETF inflows are the clearest signal yet of institutional patience.
One question remains for investors: will this top-5 ETF momentum be the spark that finally ignites HBAR’s next major leg higher?
More Must-Reads:
How do you rate this article?
Subscribe to our YouTube channel for crypto market insights and educational videos.


Join our Socials
Briefly, clearly and without noise – get the most important crypto news and market insights first.
Most Read Today
1
Cardano Foundation Slashes ADA Holdings From 76.7% to 51.6% — Bearish Signal?
2Can Bitcoin Hold $65k as ETF and CME Flows Go Offline for the Holiday Weekend?
3Ripple Launches the First Treasury Management System — What This Means for XRP’s Enterprise Utility
4BNB Chain’s Staking Rewards Jump Nearly 10x — Can Surging Yields Reverse the 3-Week Slide?
5How Accurate Are Robert Kiyosaki’s Predictions?
Latest


8
Also read
Similar stories you might like.
Altcoins
Toncoin’s Defining Moment: Can Telegram’s 1 Billion Users Trigger a Breakout in April?
Azeez | 2026-04-05
Altcoins
BNB Chain’s Staking Rewards Jump Nearly 10x — Can Surging Yields Reverse the 3-Week Slide?
Azeez | 2026-04-04

Bitcoin
Bitcoin Consolidation Continues as Market Signals Rising Volatility; What’s Next?
Ana | 2026-04-03

Industry
Two More U.S. States Grant DAOs Legal Recognition
Ana | 2026-04-03
Defi
Coinbase Lands OCC Approval in Major U.S. Crypto Shift
Ana | 2026-04-03

Defi
CFTC Sues Arizona, Illinois, Connecticut for Blocking Prediction Markets
Rokas | 2026-04-03
Defi
Ripple’s Brokerage Arm Lands Investment-Grade Rating as Expansion Continues
Rokas | 2026-04-03

Altcoins
NEAR Horizon: Is the Ecosystem Ready for the Next Wave of Mass Adoption?
Azeez | 2026-04-03
Defi
Major EU Bank CaixaBank Moves Into Crypto Under MiCA
Ana | 2026-04-02
Defi
This Wall Street Giant Bought Crypto Firm Despite Market Slump
Rokas | 2026-04-02