


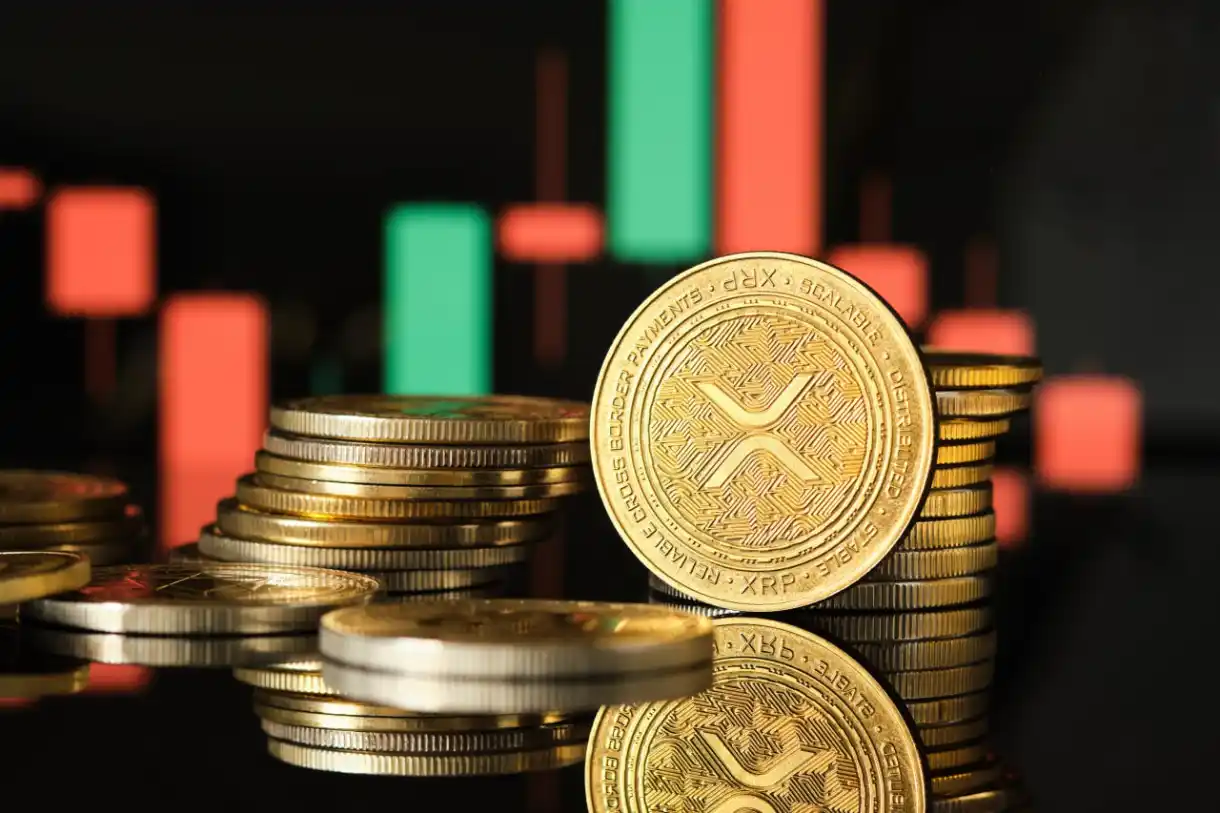
XRP coin. Source: TechGaged / Shutterstock
Bigger Move Ahead Looms for XRP – Here’s Why
In Brief
- • Analyst says XRP repeating pre-rally cycle patterns.
- • Long compression phases historically precede vertical expansions.
- • Thesis depends on cycles repeating and macro alignment.
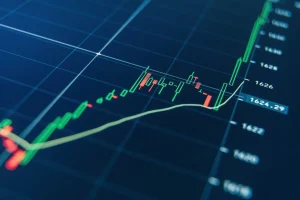
A new XRP chart is making rounds, pointing to repeating macro patterns across the asset’s history. Its breakdown suggests XRP is once again forming a familiar structure seen before major expansions. If the pattern holds, the next phase could define the cycle.
What The XRP “Breadcrumb” Theory Claims
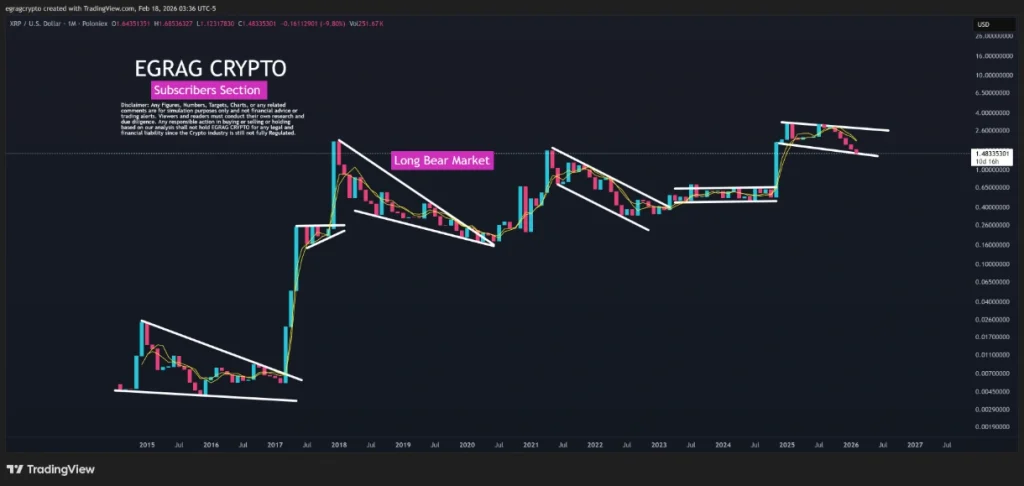
Indeed, the analysis, shared by renowned cryptocurrency trading specialist EGRAG CRYPTO in an X post on February 18, argues that XRP moves in structured phases rather than chaotic cycles.
According to the chart, every major rally begins with years of compression where price drifts sideways, and volatility fades.
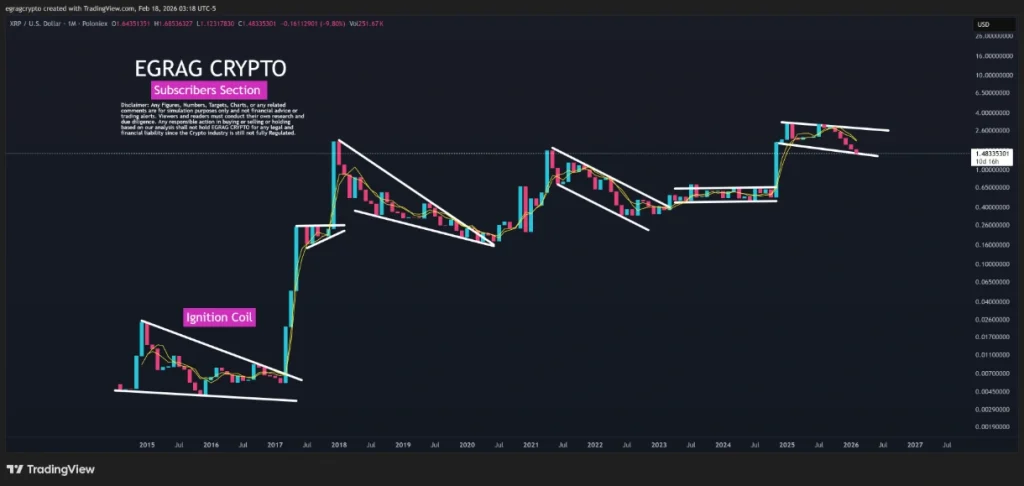
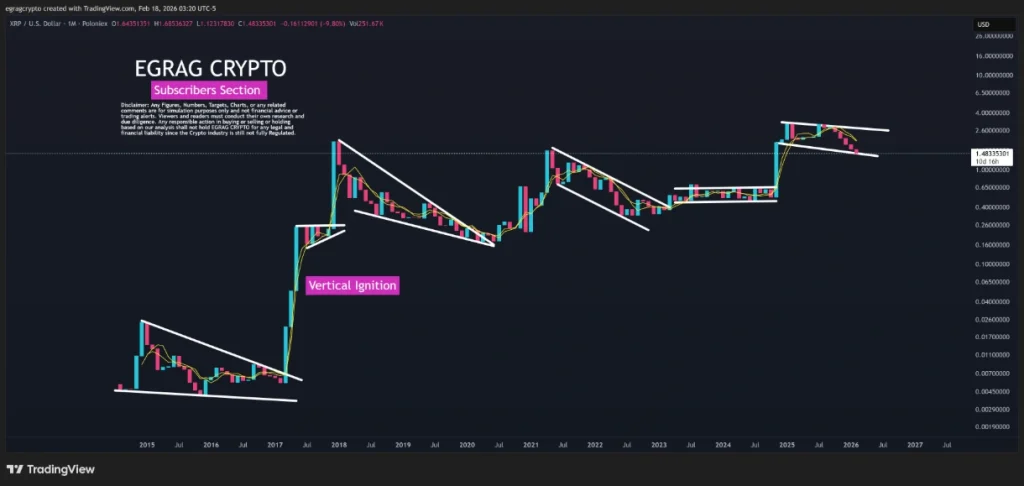
That phase is followed by sudden vertical expansions, like the explosive moves seen in 2017 and later in 2021.
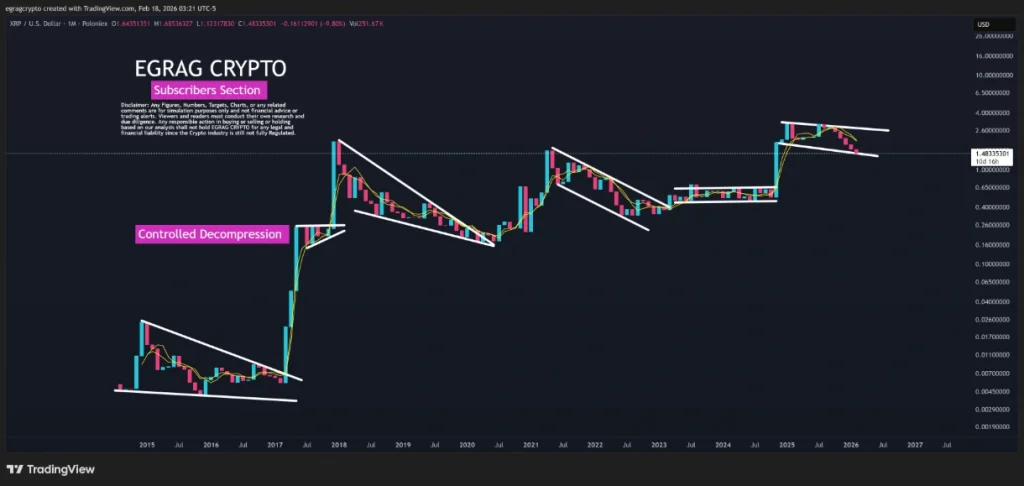
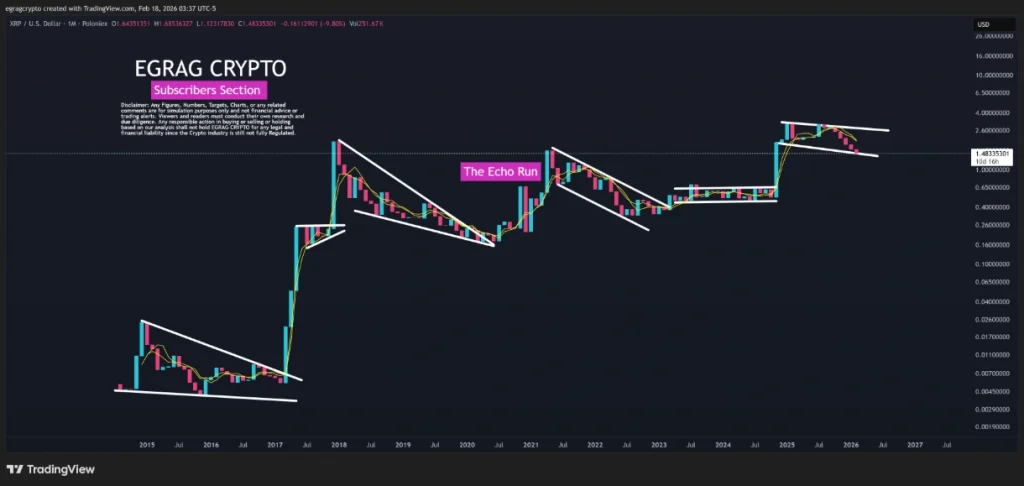
EGRAG labels these repeating segments as “breadcrumbs,” essentially recurring formations that mark where XRP sits in the broader cycle. The current structure, shown as a descending channel after a breakout, resembles earlier continuation setups that eventually led to another expansion leg.
Though this interpretation is not universally accepted, pattern-based frameworks remain widely used in crypto markets where historical structure often guides sentiment.
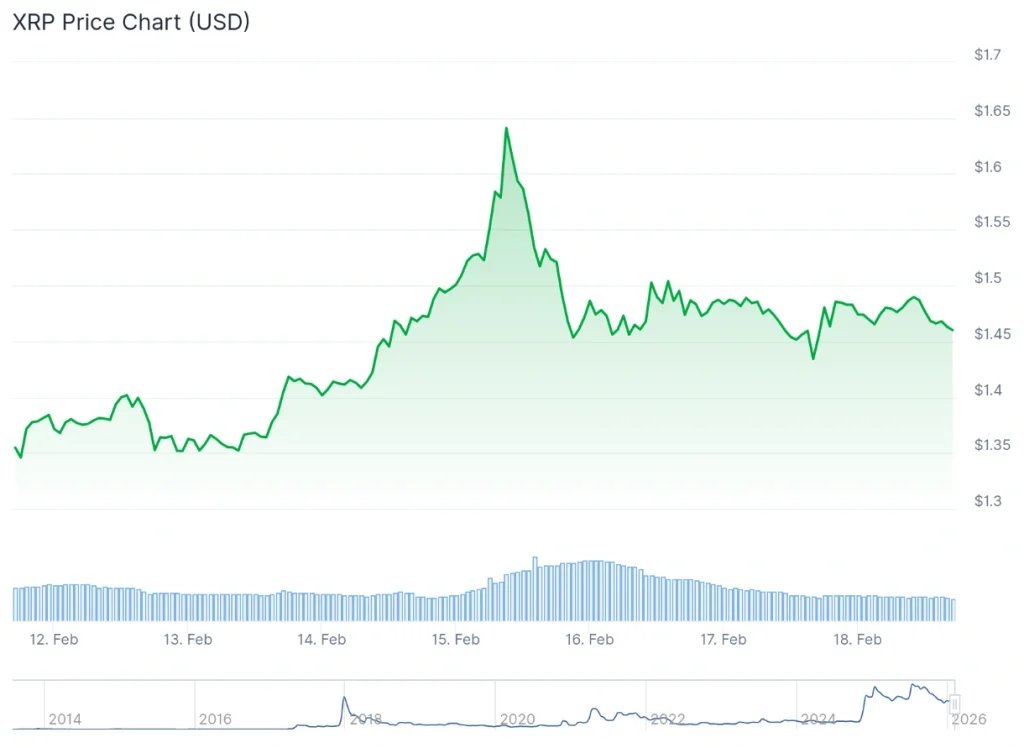
For the time being, XRP is trading at $1.46, down 1.4% on the day, up 7.8% across the week, and losing 27.8% over the last month, according to the most recent price chart information.
Why Traders Are Paying Attention
XRP has spent years moving sideways compared to other major altcoins and Bitcoin (BTC), which naturally builds curiosity around whether accumulation is happening under the surface.
The current setup described in the chart suggests a cooling phase rather than a trend reversal. In previous cycles, similar formations acted as momentum resets before renewed upside or, as EGRAG puts it, “Every time XRP finishes this structure, it follows with… another Vertical Expansion candle.”
If traders believe that logic still applies, the market could start positioning around structural confirmation rather than short-term price swings.
Still, the thesis depends on one key assumption, that crypto cycles continue to rhyme with prior ones. If macro liquidity shifts or regulatory factors change the rhythm, historical symmetry may matter less.
For now, the chart is less about certainty and more about framing. It offers a structured way to think about XRP’s position in the cycle, and that alone is enough to keep traders watching closely.
XRP Price Today
More Must-Reads:
How do you rate this article?
Subscribe to our YouTube channel for crypto market insights and educational videos.


Join our Socials
Briefly, clearly and without noise – get the most important crypto news and market insights first.

Most Read Today
1
3 Cryptocurrencies to Avoid in April
2Arthur Hayes’ $1.1M HYPE Bet: Is ETF Buzz Igniting a Surge?
3Oil Loses $100 Grip — Will Bitcoin Benefit From the Shift?
4April 12 Token Unlock: What it Could Mean for Aptos Price
5Exclusive: Dr. Persichetti Challenges Key Claims in Cointelegraph’s Quantum Crypto Analysis
Latest


8
Also read
Similar stories you might like.

Altcoins
Post-Ceasefire Crypto Outlook: Hangover or Buying Opportunity Ahead?
Azeez | 2026-04-12

Bitcoin
Oil Loses $100 Grip — Will Bitcoin Benefit From the Shift?
Azeez | 2026-04-12
Altcoins
Arthur Hayes’ $1.1M HYPE Bet: Is ETF Buzz Igniting a Surge?
Azeez | 2026-04-12

Altcoins
April 12 Token Unlock: What it Could Mean for Aptos Price
Azeez | 2026-04-12
Altcoins
3 Cryptocurrencies to Avoid in April
Azeez | 2026-04-11
Altcoins
Solana Price Outlook as SOL Hits 167M Users in April
Azeez | 2026-04-11

Altcoins
2 Cryptocurrencies to Buy in April
Azeez | 2026-04-11

Altcoins
CME Group To Launch Sui Futures and Institutions Are Betting Big On It
Azeez | 2026-04-11
Bitcoin
Bitcoin Holds Ground as Oil and War Headlines Clash
Ana | 2026-04-10
Altcoins
Will BNB Chain’s Annual Percentage Yield Surge Push Prices Higher or Be a Trap?
Azeez | 2026-04-10