


Bitcoin price drop. Source: TechGaged / Shutterstock
Bitcoin Bear Cycle Warning – Here’s What It Means
In Brief
- • Analyst warns rising volatility may signal early bear cycle.
- • Liquidity trends remain the key confirmation factor.
- • Bitcoin may be moving from early to broader downturn phase.
Bitcoin (BTC)’s current market structure may be more fragile than many investors believe. A recent analysis shows that volatility, a metric closely tracked by quantitative traders, suggests Bitcoin could still be early in a broader bear cycle. Though price action remains relatively stable compared to past downturns, underlying signals tell a different story.
Volatility Signals Bear Market Pressure
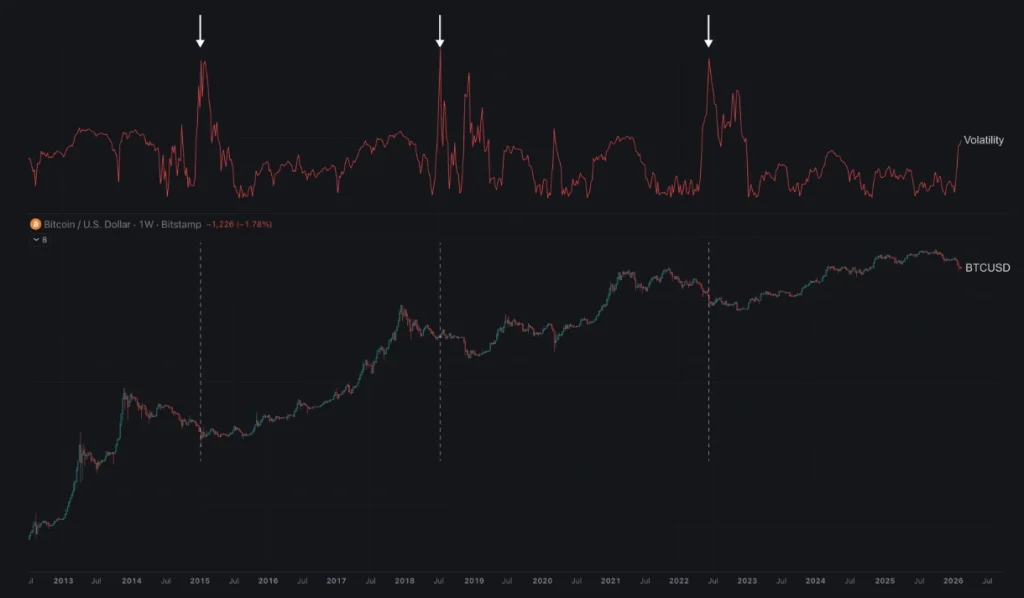
Indeed, according to an analysis shared by popular cryptocurrency industry expert Willy Woo on February 18, rising volatility has historically marked the beginning of Bitcoin bear markets.
When volatility spikes sharply and continues climbing, it often reflects growing uncertainty, capital outflows, and weakening liquidity, which are all the key ingredients for a prolonged downturn.
In previous cycles, volatility typically peaks mid-to-late bear market, followed by smaller spikes near macro bottoms that signal capitulation. This framework places volatility as an early warning indicator rather than a lagging signal.
Liquidity Still The “Gold Standard”
Despite highlighting volatility, Woo stressed that liquidity remains the most reliable macro signal. He noted that internal models tracking capital flows and investor behavior currently support the bearish volatility read.
If liquidity continues weakening, price trends may follow, especially in an asset as liquidity-sensitive as Bitcoin. Because Bitcoin is relatively small compared to global markets, it tends to react faster when capital shifts. This is why BTC often leads broader macro risk cycles by months.

A Three-Phase Bitcoin Bear Model
Next, Woo outlined a three-stage framework for understanding Bitcoin bear markets.
In Phase 1, liquidity breaks down, and price begins trending lower.
This stage is often dismissed by bulls as a correction. Phase 2 is where broader markets turn bearish. Global equities weaken, confirming a full risk-off environment.
Finally, in the last stage, Phase 3, capital outflows stabilize, and investors return. This phase usually includes final capitulation before recovery.
“The light at the end of the tunnel. In this phase, we see liquidity starting to turn around, the outflow of capital peaks and starts to stabilise. Investors are returning. A final price capitulation is usually found in this phase, either before or slightly after the peak outflows.”
Under this model, Woo believes Bitcoin may currently be transitioning from Phase 1 toward Phase 2.
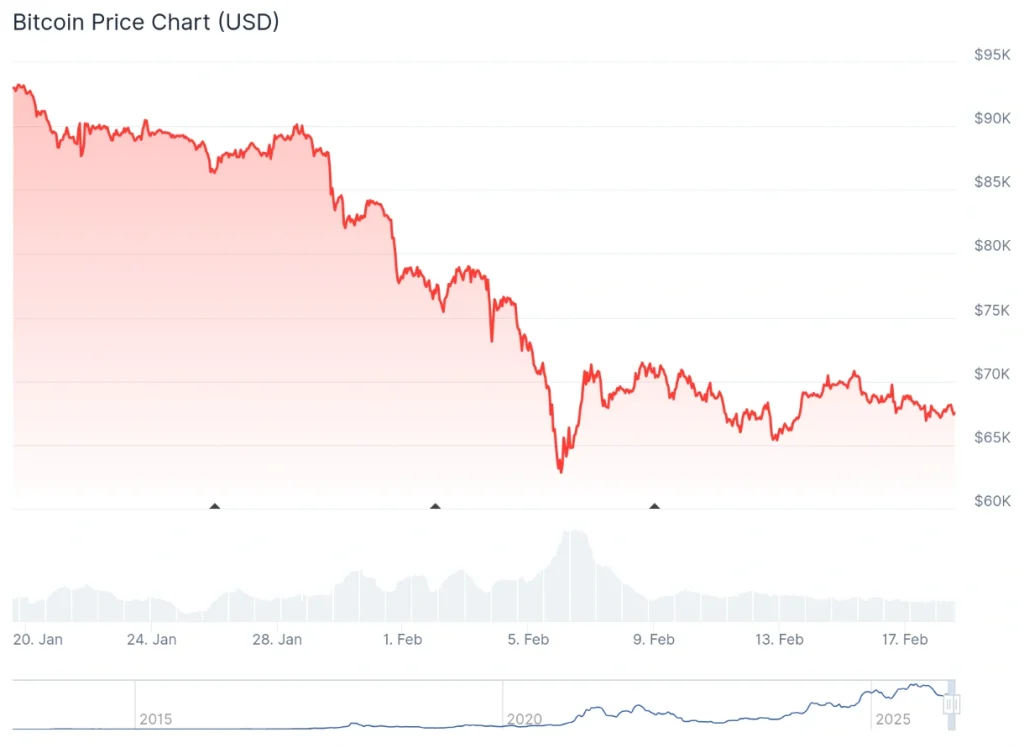
Meanwhile, the flagship asset of the crypto market is trading at the price of $67,466.03, indicating a 0.4% decline on the day, advancing 0.6% across the week, and accumulating a drop of 27.4% over the past month, according to the most recent chart data.
Why This Matters For Investors
If the framework proves accurate, it suggests Bitcoin’s next major move may depend more on macro liquidity than short-term narratives. That could mean slower recoveries after rallies, higher sensitivity to global markets, and increased volatility before a true bottom forms.
However, Woo also emphasized that volatility is just one lens among many. Bear market timing remains complex, and multiple indicators are needed for confirmation.
Bitcoin Price Today
More Must-Reads:
How do you rate this article?
Subscribe to our YouTube channel for crypto market insights and educational videos.


Join our Socials
Briefly, clearly and without noise – get the most important crypto news and market insights first.
Most Read Today
1
Exclusive: $250M Asset Manager Breaks Down Morgan Stanley’s Bitcoin ETF Impact
2Jim Cramer Prediction Accuracy: Full Report (2000–2026)
3XRP Whales Buying Rises Ahead of Major Ripple XRPL Japan Event
4Bitcoin Jumps to Three-Week High as Crypto Adds $100B
510K BTC at $50 Got Zero Bids, Now It’s Worth Hundreds of Millions
Latest


8
Also read
Similar stories you might like.

Blockchain
FBI Warning: Crypto Losses Hit $11B as Scams Surge
Ana | 2026-04-08

Altcoins
Bitcoin Jumps to Three-Week High as Crypto Adds $100B
Ana | 2026-04-08

Altcoins
Unleashing STRIDE: Could It Spark Thrilling Gains for Solana?
Azeez | 2026-04-08

Altcoins
Van Rossem Upgrade in Focus—Could It Trigger Cardano’s Next Big Price Move?
Azeez | 2026-04-08

Bitcoin
Quantum Threat: Experts Say Bitcoin Encryption May Not Last a Decade
Ana | 2026-04-08

Defi
Reshaping Payments: FDIC Moves to Set Rules for Stablecoin Issuers
Rokas | 2026-04-08

Bitcoin
10K BTC at $50 Got Zero Bids, Now It’s Worth Hundreds of Millions
Rokas | 2026-04-08

Market
Jim Cramer Prediction Accuracy: Full Report (2000–2026)
Sead | 2026-04-08

Bitcoin
Exclusive: $250M Asset Manager Breaks Down Morgan Stanley’s Bitcoin ETF Impact
Sead | 2026-04-08

Bitcoin
Bitcoin Rejects $70K as Geopolitical Tensions Rise
Ana | 2026-04-07