


XRP phone screen. Source: TechGaged / Shutterstock
Gravestone Doji: XRP Just Flashed a Brutal Historical Signal
In Brief
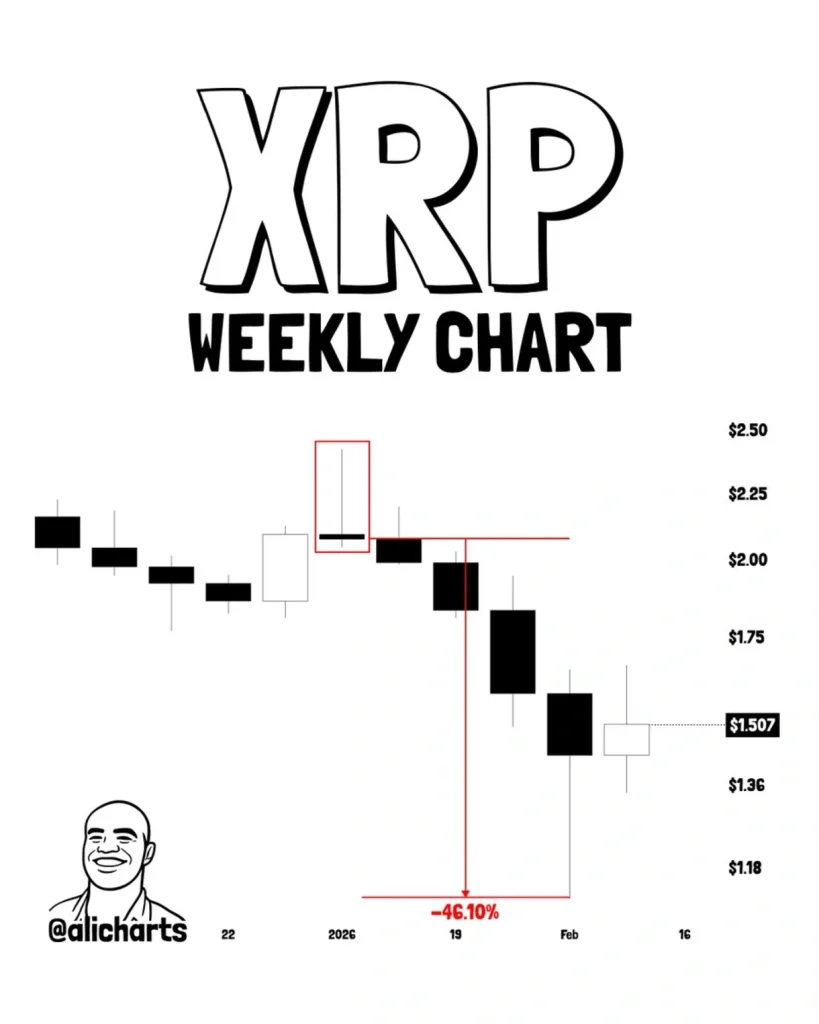
- • XRP printed a rare weekly gravestone doji.
- • Last time, price fell ~46%.
- • Confirmation depends on follow-through selling.
XRP may be flashing a rare warning signal on higher timeframes, according to a cryptocurrency analyst who pointed to a historical gravestone doji formation on the weekly chart. The last time XRP printed this candlestick pattern, the market saw a sharp decline that ensnared nearly half of the asset’s value.
A Rare Candlestick With a Strong Track Record
A gravestone doji forms when the price rallies strongly during a season but closes near its opening level, leaving a long upper wick. The structure typically reflects aggressive rejection at higher levels and a shift in momentum from buyers to sellers.
According to the analysis shared by popular crypto trading expert Ali Martinez in an X post on February 16, the previous weekly gravestone doji preceded a 46% drop in XRP’s price, highlighting the pattern’s potential significance on macro timeframes.
Because weekly candles carry more weight than shorter-term signals, similar formations tend to attract attention from swing traders and long-term investors.
Why Traders Are Watching This Closely
If XPR has, indeed, printed another gravestone doji on the weekly chart, it could suggest a strong resistance at higher levels, potential distribution from large holders, and an increased downside volatility.
However, analysts stress that candlestick patterns should not be viewed in isolation. Broader market trends, Bitcoin (BTC) dominance, and macro liquidity conditions remain key drivers of XRP’s trajectory.
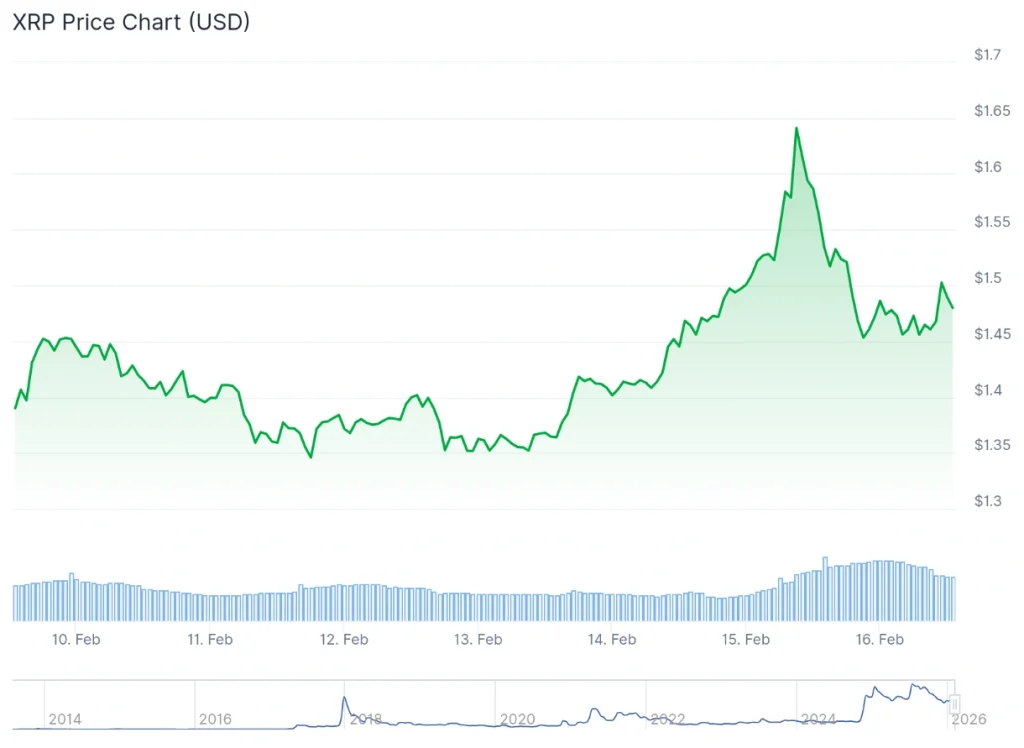
Currently, this altcoin is changing hands at the price of $1.48, suggesting a 6.1% decline in the last 24 hours, an advance of 6.5% across the past seven days, and an accumulated dip of 28.3% over the month, according to the most recent chart information.
What Comes Next for XRP
For bears, confirmation would likely require follow-through selling and lower weekly closes. A sustained breakdown below key support levels could validate the historical pattern.
For bulls, invalidation would come from reclaiming resistance and turning the gravestone doji into a failed bearish signal, something that occasionally happens during strong uptrends.
All things considered, XRP has flashed a rare weekly sign that once preceded a major correction, but whether history repeats may depend on broader market momentum.
XRP Price Today
More Must-Reads:
How do you rate this article?
Subscribe to our YouTube channel for crypto market insights and educational videos.


Join our Socials
Briefly, clearly and without noise – get the most important crypto news and market insights first.
Most Read Today
1
60,000 GPUs on the Line: Could Render’s RNP-023 Ignite a Supply Crunch?
2Coinbase Lands OCC Approval in Major U.S. Crypto Shift
3Ripple’s Brokerage Arm Lands Investment-Grade Rating as Expansion Continues
4NEAR Horizon: Is the Ecosystem Ready for the Next Wave of Mass Adoption?
5TAO Subnet Reality Check: Revenue vs. Subsidies – What Investors Must Know After the Rally
Latest


8
Also read
Similar stories you might like.
Bitcoin
Bitcoin Consolidation Continues as Market Signals Rising Volatility; What’s Next?
Ana | 2026-04-03
Industry
Two More U.S. States Grant DAOs Legal Recognition
Ana | 2026-04-03

Defi
Coinbase Lands OCC Approval in Major U.S. Crypto Shift
Ana | 2026-04-03

Defi
CFTC Sues Arizona, Illinois, Connecticut for Blocking Prediction Markets
Rokas | 2026-04-03

Altcoins
60,000 GPUs on the Line: Could Render’s RNP-023 Ignite a Supply Crunch?
Azeez | 2026-04-03

Defi
Ripple’s Brokerage Arm Lands Investment-Grade Rating as Expansion Continues
Rokas | 2026-04-03

Altcoins
NEAR Horizon: Is the Ecosystem Ready for the Next Wave of Mass Adoption?
Azeez | 2026-04-03

Defi
Major EU Bank CaixaBank Moves Into Crypto Under MiCA
Ana | 2026-04-02

Blockchain
Solana-Based Drift Protocol Halts Operations After Security Breach; What Happened?
Ana | 2026-04-02
Industry
Iran Demands Crypto, Yuan Fees For Passage Through Hormuz
Ana | 2026-04-02