


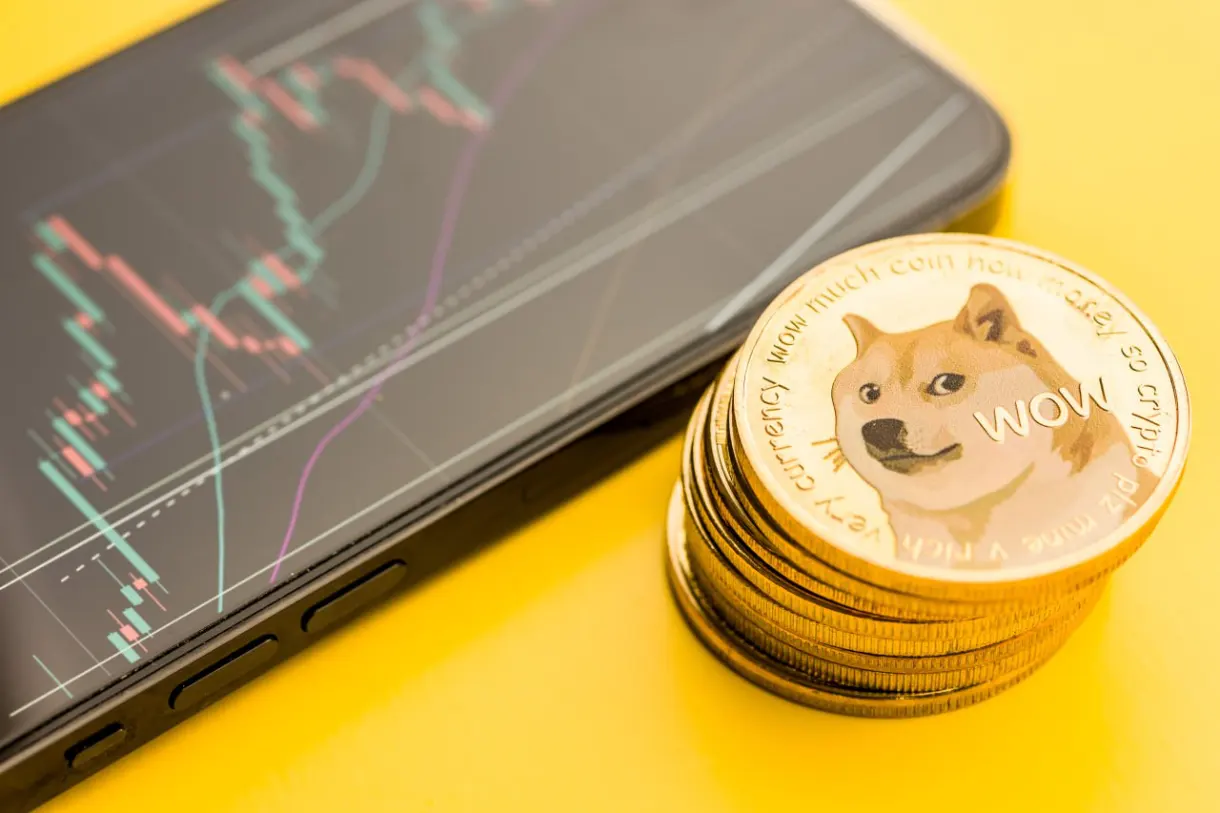
Dogecoin coins stack. Source: TechGaged / Shutterstock
DOGE Just Marked A Powerful Buy Zone
In Brief
- • DOGE flashed a buy signal at channel support.
- • Similar setups led to rallies.
- • Needs confirmation to validate upside.
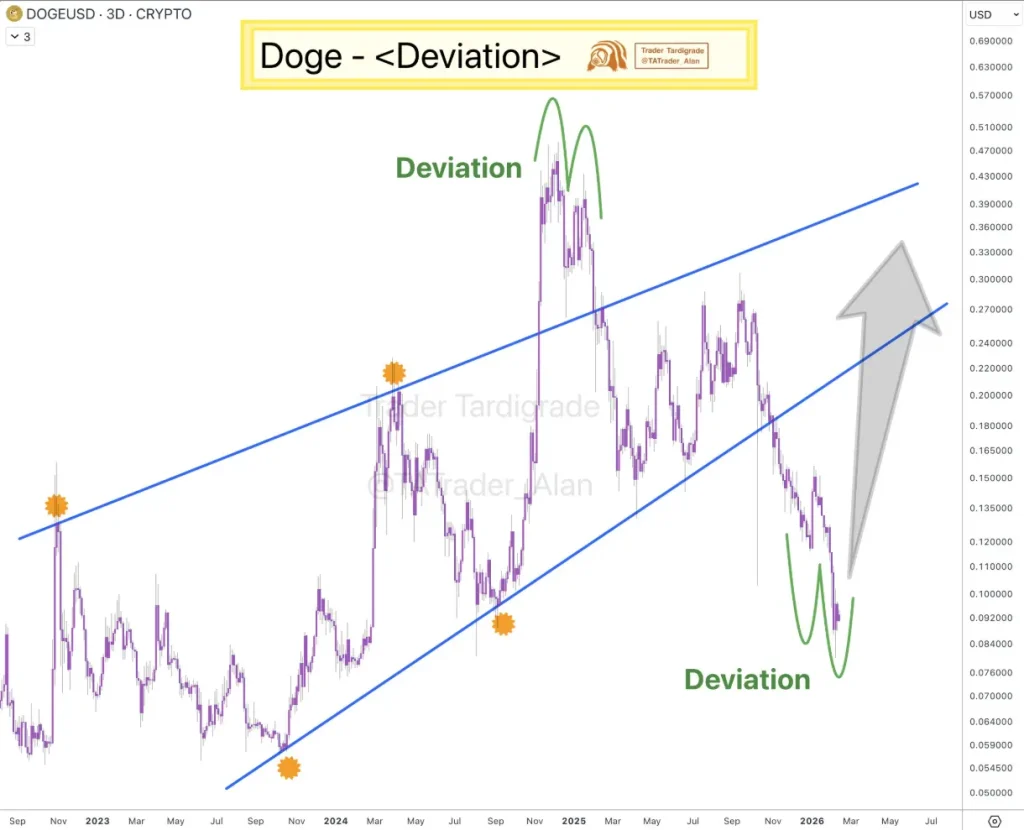
Dogecoin (DOGE) has flashed another technical buy signal on the 3-day chart, with price tagging the lower boundary of its rising channel. One analyst says previous touches of this pattern border preceded strong upside moves. If history repeats, DOGE may be setting up for another volatility expansion.
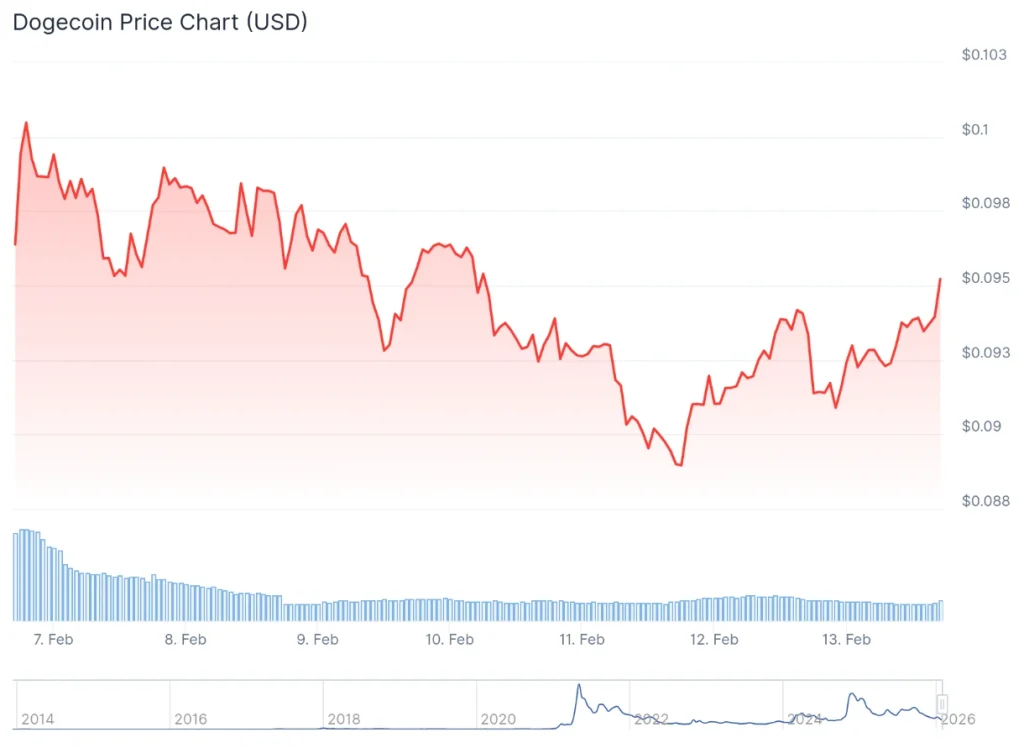
What The Chart Shows
On the 3-day timeframe observed by cryptocurrency market specialist Trader Tardigrade in an X post on February 13, Dogecoin remains inside a broader upward channel structure.
The key signals highlighted include orange dots, which represent buy signals at the lower channel border, green spikes suggesting ‘massive deviation’ events before sharp reversals, and the current price, sitting at the pattern support zone.
In previous instances of this cycle, when DOGE deviated below the structure and printed a buy dot, strong rallies followed. The analyst argues this ‘deviation loading’ phase often shakes out weak hands before momentum returns.
Why This Matters For Crypto Traders
Deviation setups typically signal oversold conditions within a larger structure, liquidity sweep before reversal, and early positioning before breakout. If this level holds, DOGE could attempt a move toward the upper channel boundary, currently projected significantly higher.
However, confirmation would require a strong bullish follow-through, rising volume, and reclaiming nearby resistance zones. Failure to hold the channel could invalidate the setup and extend downside risk.
For the time being, DOGE is trading at $0.09537, indicating a 1.9% gain in the last 24 hours, a decline of 1.2% across the past seven days, and an accumulated loss of 36.1% over the last month, according to the most recent price chart information.
Bottom Line
Dogecoin is sitting at a technically important inflection point. The pattern has produced reliable buy signals earlier in this cycle. Now traders are watching whether this ‘loaded’ structure results in another explosive leg higher or if this time the channel finally breaks.
DOGE Price Today
More Must-Reads:
How do you rate this article?
Join our Socials
Briefly, clearly and without noise – get the most important crypto news and market insights first.
Most Read Today
1
Coinbase Lands OCC Approval in Major U.S. Crypto Shift
2Ripple’s Brokerage Arm Lands Investment-Grade Rating as Expansion Continues
360,000 GPUs on the Line: Could Render’s RNP-023 Ignite a Supply Crunch?
4NEAR Horizon: Is the Ecosystem Ready for the Next Wave of Mass Adoption?
5TAO Subnet Reality Check: Revenue vs. Subsidies – What Investors Must Know After the Rally
Latest


8
Also read
Similar stories you might like.

Bitcoin
Bitcoin Consolidation Continues as Market Signals Rising Volatility; What’s Next?
Ana | 2026-04-03

Industry
Two More U.S. States Grant DAOs Legal Recognition
Ana | 2026-04-03

Defi
Coinbase Lands OCC Approval in Major U.S. Crypto Shift
Ana | 2026-04-03

Defi
CFTC Sues Arizona, Illinois, Connecticut for Blocking Prediction Markets
Rokas | 2026-04-03

Altcoins
60,000 GPUs on the Line: Could Render’s RNP-023 Ignite a Supply Crunch?
Azeez | 2026-04-03

Defi
Ripple’s Brokerage Arm Lands Investment-Grade Rating as Expansion Continues
Rokas | 2026-04-03

Altcoins
NEAR Horizon: Is the Ecosystem Ready for the Next Wave of Mass Adoption?
Azeez | 2026-04-03

Defi
Major EU Bank CaixaBank Moves Into Crypto Under MiCA
Ana | 2026-04-02

Blockchain
Solana-Based Drift Protocol Halts Operations After Security Breach; What Happened?
Ana | 2026-04-02

Industry
Iran Demands Crypto, Yuan Fees For Passage Through Hormuz
Ana | 2026-04-02