


Shiba Inu logo. Source: TechGaged / Shutterstock
Shiba Inu Breakdown Signals Possible 30% Move
In Brief
- • Shiba Inu broke below its weekly channel.
- • Deeper support levels are now in focus.
- • Traders await confirmation or a rebound.
Ad
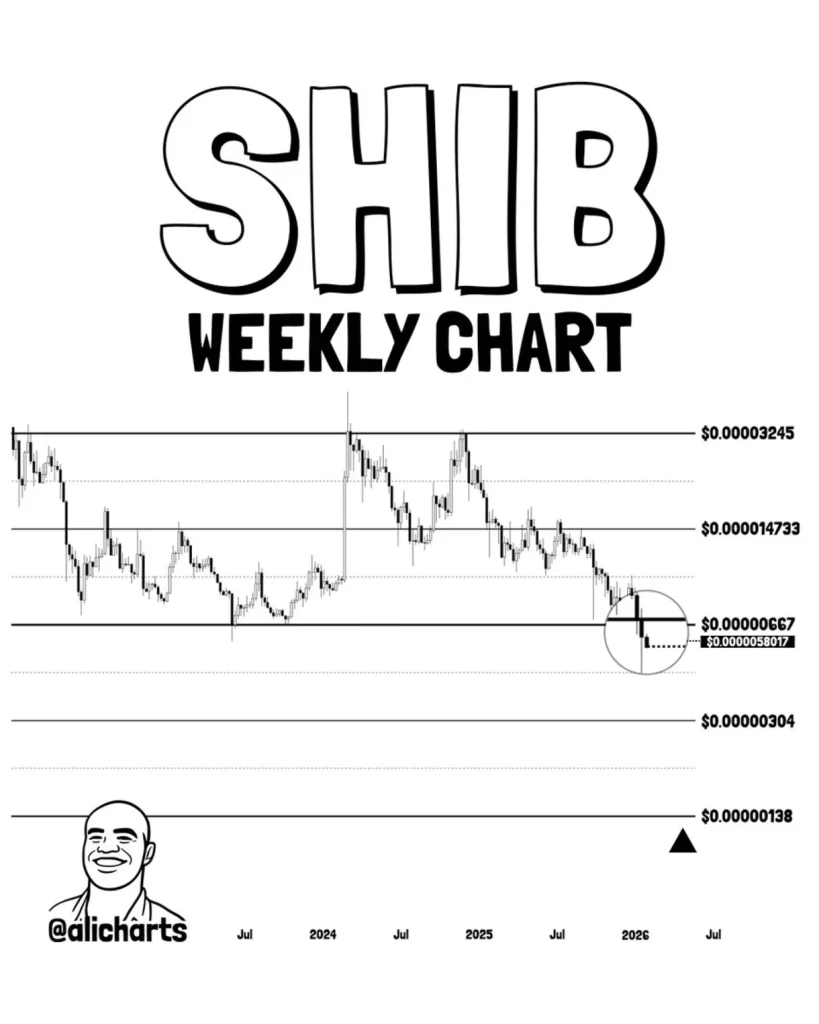
Shiba Inu (SHIB) has broken below its long-standing weekly price channel, putting $0.00000138 in focus as a potential downside level, with the breakdown occurring on the higher timeframe, a signal traders often treat as structurally significant.
If the move, highlighted in an analysis shared by prominent cryptocurrency market expert Ali Martinez in an X post on February 12, is confirmed, it could shift Shiba Inu’s medium-term trend and increase volatility.
What Just Happened?
On the weekly chart, SHIB had been trading inside a descending channel for an extended period. The price has now moved below the lower boundary of that structure, a development typically interpreted as a bearish continuation signal.
Now, the key levels in play include immediate support near $0.00000667 and major historical support around $0.00000138. The $0.00000138 level marks a prior structural base and would represent a substantial retracement from current prices if tested.
Why This Level Matters
Breakdowns on higher timeframes like the weekly chart tend to carry more weight than intraday moves. When support structures fail, it can signal weakening bullish momentum, extended consolidation phases, and/or elevated short-term volatility.
However, technical breakdowns require confirmation. Traders will be watching for a decisive weekly close below the channel, whether the price reclaims the lost support quickly, and the volume expansion validating the move.
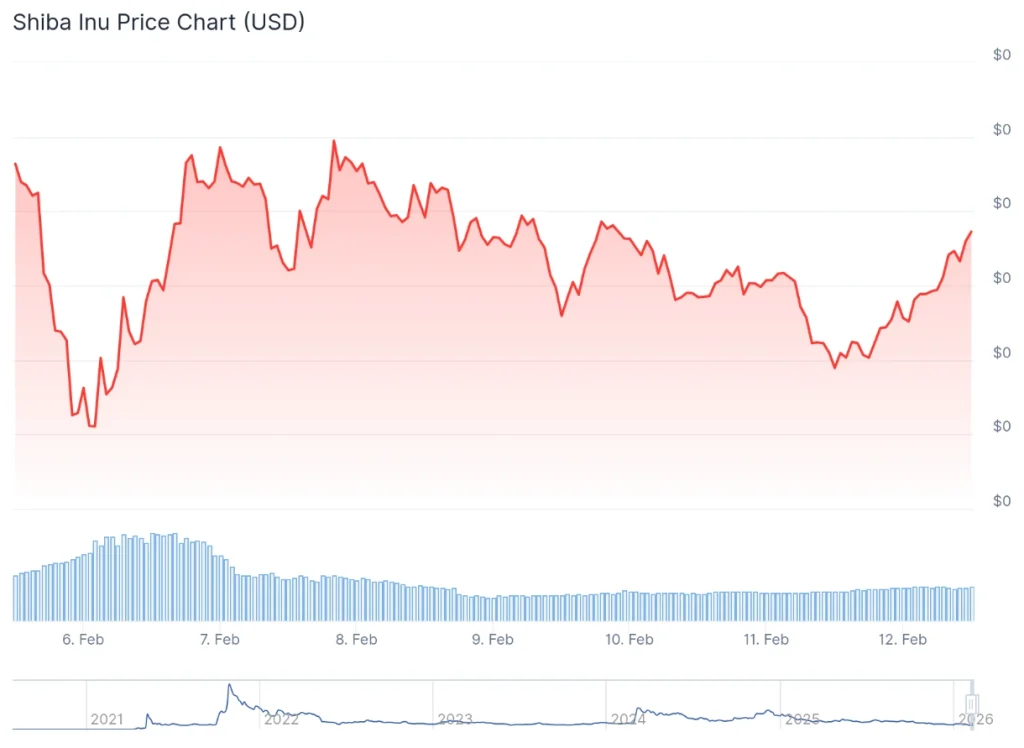
At the moment, Shiba Inu is trading at $0.000006145, indicating a 6.1% gain in the last 24 hours, a decline of 2.9% across the past seven days, and an advance of 28.4% over the month, according to the latest data.
What Happens Next?
If SHIB remains below the broken channel, the path toward $0.00000138 becomes technically viable. A strong recovery back inside the channel, however, would invalidate the setup and potentially trap short positions.
For now, Shiba Inu sits at a key inflection point, and how the price reacts at these levels could determine its next broader trend direction.
Shiba Inu Price Today
More Must-Reads:
How do you rate this article?
Subscribe to our YouTube channel for crypto market insights and educational videos.


Join our Socials
Briefly, clearly and without noise – get the most important crypto news and market insights first.


8
Also read
Similar stories you might like.

Industry
Trump Backs Bitcoin, Stablecoins In New Pro-Crypto Push
Ana | 2026-03-30
Industry
Canada Proposes Ban on Crypto Political Donations
Ana | 2026-03-30

Altcoins
Ethereum Foundation Makes Record ETH Staking Move
Ana | 2026-03-30
Bitcoin
Bitcoin Miners Turn to AI as Profits Collapse
Ana | 2026-03-30

Bitcoin
Mystery Deepens as $400M ‘Lost’ Bitcoin Suddenly Moves
Rokas | 2026-03-30

Altcoins
Kiyosaki Warns of Inflation Crisis, Lists 6 Safest Investments for 2026
Rokas | 2026-03-30

Altcoins
TRON Moves Toward Institutions: How Anchorage Support Could Influence TRX Price
Azeez | 2026-03-29
Altcoins
Gold Enters DeFi: Tether’s XAUt Expansion to BNB Chain Could Shift Market Dynamics
Azeez | 2026-03-29

Altcoins
Sui Approaches 800K Users as Token Unlock Nears — Can Price Stay Resilient?
Azeez | 2026-03-29
Altcoins
Could SpaceX’s IPO Be the Catalyst That Sends Dogecoin Above $0.10?
Azeez | 2026-03-29