


Momentum exhaustion gives way to reset conditions as XRP approaches a key technical inflection point.
XRP Momentum Resets Near Key RSI Band, Upside Next
In Brief
- • XRP’s RSI has reset into a key historical support zone.
- • An analyst says this signals momentum cooling, not trend failure.
- • The setup may be preparing for the next upside phase.
Ad
XRP’s macro relative strength index (RSI) continues to weaken, slipping from 46.90 to 45.87, but according to one cryptocurrency analyst, this move may be less about trend failure and more about preparing for the next expansion phase.
From a macro perspective, RSI behavior like this has historically appeared near the end of corrective cycles, not the beginning of prolonged bear markets, per the observations shared by prominent crypto trading expert EGRAG CRYPTO in an X post on February 5.
Why This RSI Move Is Different
EGRAG notes that XRP’s RSI is now sitting inside a long-standing macro support band between 45 and 50 (dropping from 46.90 to 45.87 and still going), a zone that has never broken decisively in prior XRP cycles.
Instead of signaling weakness, this region has repeatedly acted as a momentum reset, flushing leveraged and short-term participants before stronger moves higher.
As EGRAG explained, “This RSI move is a momentum reset, not trend failure,” adding that markets often compress momentum “to flush weak hands before expansion.”
Crucially, the analyst argues that the structure now points to Wave 2 ending, not Wave 4. In Elliott Wave terms, this distinction matters as Wave 3 is historically the most aggressive and directional phase of a cycle.
What The RSI Is Telling Traders
According to EGRAG’s macro view, the downside momentum is aggressive, but not retail-driven; the selling pressure appears institutional, tied to liquidity sweeps, and the RSI compression at these levels has consistently preceded expansion as opposed to collapse.
He also emphasized that RSI only turns structurally bearish if it loses the ~43 level, something that has not occurred so far. As EGRAG stated, underscoring that volatility inside a broader bullish structure is normal:
“Reset does not mean reversal, and cooling does not mean collapse.”
What Comes Next For XRP
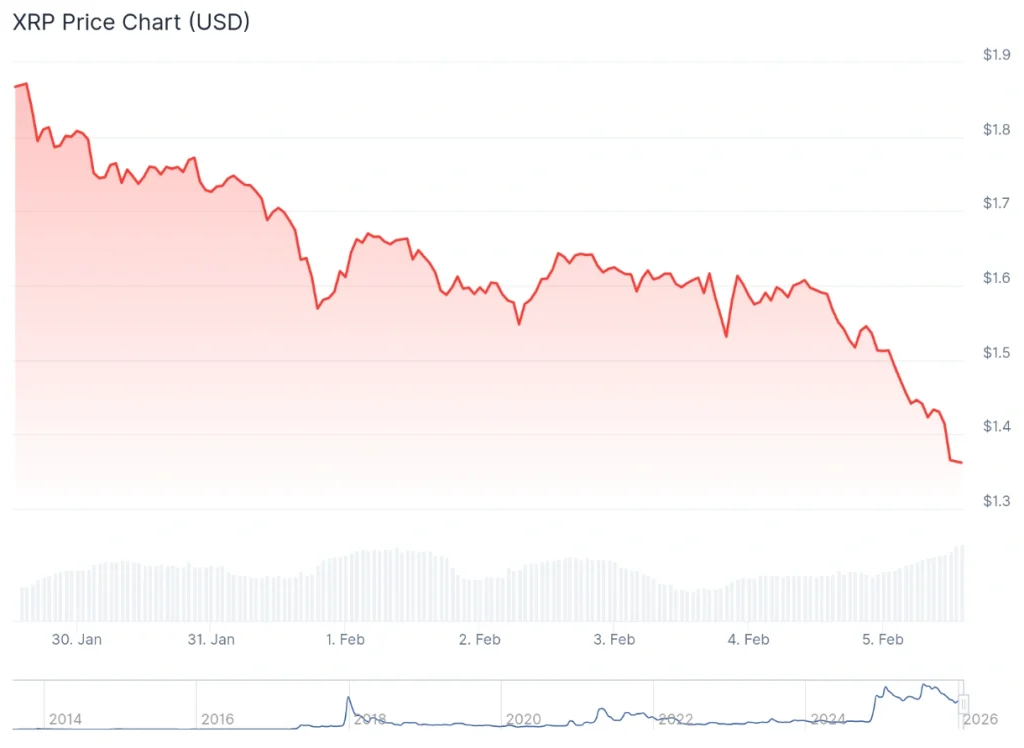
For the time being, XRP is trading at $1.36, which represents a decline of 14.4% in the last 24 hours, a more significant loss of 27.1% across the past seven days, and an accumulated dip of 42.6% over the month, per the latest price chart data.
Though short-term price action may remain uncomfortable, the macro RSI setup suggests XRP is approaching a decision point, not a breakdown. If historical behavior repeats, this phase represents fuel being stored, not demand disappearing.
As EGRAG put it succinctly:
“If structure holds, this isn’t fear… It’s fuel.”
For long-term participants, the question now isn’t whether XRP looks weak today, but whether this reset sets the stage for the next major wave higher.
XRP Price Today
More Must-Reads:
How do you rate this article?
Subscribe to our YouTube channel for crypto market insights and educational videos.


Join our Socials
Briefly, clearly and without noise – get the most important crypto news and market insights first.
Most Read Today
1
Exclusive: AI Finance Is Now “Institutional Grade”, Says True Trading Co-Founder Igor Stadnyk
2XLM Sees Significant 7.9% Gain, Reaches $0.179 as Market Reacts
3Bitcoin Whale Activity Returns As Exchange Pressure Builds
4SEC Moves Toward Tokenization Rules With Timeline Set
5Morgan Stanley: Wall Street’s Crypto Shift Was Years in the Making
Latest


8
Also read
Similar stories you might like.
Bitcoin
Morgan Stanley Bitcoin ETF Launch Imminent After NYSE Listing
Ana | 2026-03-26
Defi
Senator Lummis Warns Crypto Bill Delay Risks U.S. Financial Position
Ana | 2026-03-26
Bitcoin
Strategy Now Drives Nearly All Bitcoin Treasury Demand
Ana | 2026-03-26

Altcoins
Middle East Tensions Spark New XRP Buy-The-Dip Call
Rokas | 2026-03-26

Blockchain
SEC Moves Toward Tokenization Rules With Timeline Set
Rokas | 2026-03-26

Industry
McLaren Joins Hedera Network as HBAR Moves Higher After Announcement
Rokas | 2026-03-25

Altcoins
20 Crypto-Friendly Businesses Named Among America’s 300 Most Innovative Companies
Ana | 2026-03-25

Bitcoin
Bitcoin Whale Activity Returns As Exchange Pressure Builds
Ana | 2026-03-25

Altcoins
Ethereum Development Advances With New Block Model
Ana | 2026-03-25
Defi
New CFTC Task Force Puts Crypto Rules Back In Focus
Ana | 2026-03-25