


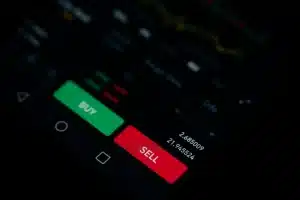


Bitcoin standing in front of a screen showing a trading chart. Source: TechGaged.
Bitcoin Risks a 2021-Style Dead Cat Bounce
In Brief
- • Bitcoin’s rebound resembles a short-term relief move seen in past cycles.
- • Structure suggests momentum remains fragile despite recent gains.
- • The next move hinges on whether key support is reclaimed or rejected.

Bitcoin (BTC) may be tracing a familiar and uncomfortable pattern with a structure that closely resembles its 2021 market cycle, a period that featured a ‘dead cat bounce’ before the price resumed a deeper decline.
The comparison, shared by renowned cryptocurrency trading specialist Ali Martinez in an X post on December 30, highlights a short-lived recovery attempt forming after a major drawdown, followed by renewed downside once support failed to hold.
While history doesn’t repeat perfectly, the structural similarities are enough to put traders on alert.
What a Dead Cat Bounce Implies
A dead cat bounce refers to a temporary relief rally that occurs after a sharp sell-off, often driven by short covering, bargain hunting, or fading panic rather than a genuine trend reversal.
These bounces can look convincing on lower timeframes but typically lack follow-through. Once buying pressure fades, price often rolls over and continues in the direction of the broader trend.
In 2021, Bitcoin staged a comparable bounce before breaking decisively lower, turning what appeared to be stabilization into a trap for late buyers.
Why the 2021 Comparison Matters Now
Martinez’s side-by-side comparison shows BTC forming a similar consolidation structure beneath a key support zone, with price action compressing before the next directional move.
Key similarities include a sharp drawdown followed by a choppy rebound, failure to reclaim prior support with conviction, and compression suggesting another volatility expansion ahead. In 2021, that setup ultimately resolved to the downside.
Short-Term Relief vs. Structural Weakness
For the time being, Bitcoin is changing hands at the price of $87,889.65, which represents an increase of 0.02% in the last 24 hours, a 0.54% gain across the previous seven days, and a loss of 3.78% accumulated on its monthly chart, per the most recent information.

The current bounce doesn’t automatically signal a market top or guarantee a repeat outcome. However, it does reinforce the idea that short-term strength can coexist with longer-term vulnerability.
Dead cat bounces are most dangerous when sentiment improves just enough to restore confidence, but not enough to repair market structure. That’s often when positioning becomes skewed, and downside accelerates.
More Must-Reads:
How do you rate this article?
Subscribe to our YouTube channel for crypto market insights and educational videos.


Join our Socials
Briefly, clearly and without noise – get the most important crypto news and market insights first.

Most Read Today
1
Whales Bought 10 Million Cardano (ADA) in 3 Days — Smart Money Positioning Early?
2Exclusive: Dr. Persichetti Challenges Key Claims in Cointelegraph’s Quantum Crypto Analysis
3Dogecoin Awakens After Seventy-Three Days as SpaceX Eyes June IPO
4Robert Kiyosaki Predicts 2026 Crash, Says Assets Will Go Cheap
5The 3 Hidden Catalysts Deciding the Bitcoin vs. Gold Winner This Month
Latest


8
Also read
Similar stories you might like.

Bitcoin
America’s Debt Now Exceeds GDP — Is This the Silent Catalyst Bitcoin Was Waiting For?
Azeez | 2026-05-03

Altcoins
Beyond Price: Accenture’s Hedera Move Could Redefine Enterprise Crypto in 2026
Azeez | 2026-05-03
Altcoins
Ripple Re-Locks 700M XRP Amid CLARITY Act Progress — Preparing for a Regulated Future?
Azeez | 2026-05-03

Altcoins
Whale Watch: Smart Money Is Silently Accumulating These Altcoins
Azeez | 2026-05-02
Altcoins
Bitcoin Cash (BCH) May 15 Upgrade: Can CashVM Actually Steal Ethereum’s DeFi Crown?
Azeez | 2026-05-02

Altcoins
Zcash (ZEC) Soars as Privacy Flywheel Locks In On-Chain Growth
Azeez | 2026-05-02

Altcoins
Hyperliquid vs. Solana: Which Layer-1 Will Dominate the May Derivatives Surge?
Azeez | 2026-05-02

Bitcoin
The 3 Hidden Catalysts Deciding the Bitcoin vs. Gold Winner This Month
Azeez | 2026-05-01

Altcoins
Dogecoin Awakens After Seventy-Three Days as SpaceX Eyes June IPO
Azeez | 2026-05-01

Altcoins
Whales Bought 10 Million Cardano (ADA) in 3 Days — Smart Money Positioning Early?
Azeez | 2026-05-01