


Shiba Inu faces renewed downside risk if key support gives way.
SHIB Risks Deeper Losses If This Support Fails
In Brief
- • SHIB is pressing against a critical weekly support level.
- • A hold would keep consolidation intact, while a break risks deeper losses.
- • Weekly closes are key for the next directional signal.
Ad
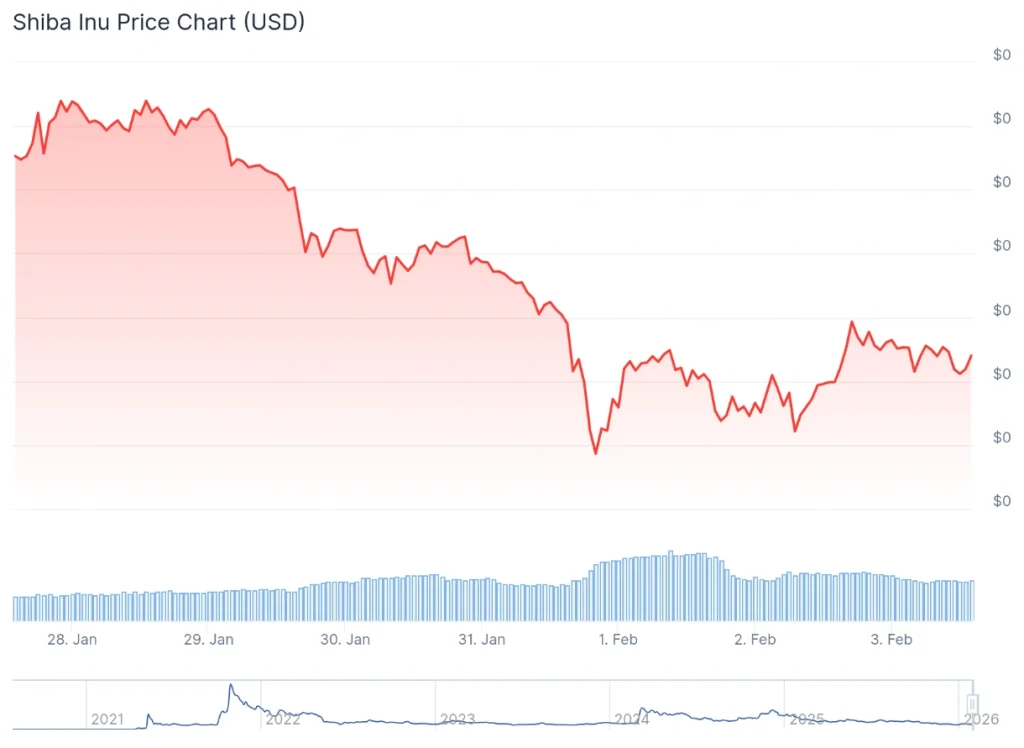
Shiba Inu (SHIB)’s weekly chart is compressing into a narrow decision zone, its price action pressing against a level that has historically defined whether SHIB stabilizes or risks sliding further.
Indeed, after months of lower highs, the next few weekly closes could determine which side wins, whether buyers can defend the current support zone or if sellers force a deeper reset, judging by the observations shared by popular cryptocurrency market expert Ali Martinez on February 3.
What The Weekly Chart Is Showing
According to the chart shared by the crypto industry analyst, SHIB’s structure now hinges on its ability to stay above the $0.0000066721 support level. That zone has repeatedly acted as a floor during past consolidations, making it one of the most technically important areas on the chart.
The broader trend, however, remains weak. SHIB has spent most of the past year forming lower highs, signaling persistent selling pressure rather than aggressive accumulation. Each bounce has been smaller than the last, a classic sign that upside conviction is fading.
Weekly charts tend to matter more than short-term moves because they reflect longer-term positioning. When a level like this fails on a weekly basis, it often opens the door to testing deeper historical demand zones below.
Why This Level Matters For Traders And Holders
For the time being, SHIB is changing hands at the price of $0.000006853, which indicates an advance of 1.6% in the last 24 hours, amid declining 10.2% across the past seven days and losing 23% on its monthly chart, according to the latest data.
Holding above support keeps SHIB in a consolidation phase, where range-bound trading and gradual accumulation remain possible. It also preserves the chance for momentum to rebuild if broader market conditions improve.
A clean breakdown, however, would shift risk sharply. Below this zone, the chart shows little structure until much lower levels, increasing the probability of faster downside moves as stop-losses trigger and liquidity thins.
For traders, this is a clarity moment. The chart has reduced the noise to a signal question: does support hold or does the downtrend extend? Until there’s an answer to this, SHIB remains technically vulnerable and tightly watched.
SHIB Price Today
More Must-Reads:
How do you rate this article?
Subscribe to our YouTube channel for crypto market insights and educational videos.


Join our Socials
Briefly, clearly and without noise – get the most important crypto news and market insights first.


8
Also read
Similar stories you might like.

Industry
Trump Backs Bitcoin, Stablecoins In New Pro-Crypto Push
Ana | 2026-03-30
Industry
Canada Proposes Ban on Crypto Political Donations
Ana | 2026-03-30

Altcoins
Ethereum Foundation Makes Record ETH Staking Move
Ana | 2026-03-30
Bitcoin
Bitcoin Miners Turn to AI as Profits Collapse
Ana | 2026-03-30

Bitcoin
Mystery Deepens as $400M ‘Lost’ Bitcoin Suddenly Moves
Rokas | 2026-03-30

Altcoins
Kiyosaki Warns of Inflation Crisis, Lists 6 Safest Investments for 2026
Rokas | 2026-03-30

Altcoins
TRON Moves Toward Institutions: How Anchorage Support Could Influence TRX Price
Azeez | 2026-03-29
Altcoins
Gold Enters DeFi: Tether’s XAUt Expansion to BNB Chain Could Shift Market Dynamics
Azeez | 2026-03-29

Altcoins
Sui Approaches 800K Users as Token Unlock Nears — Can Price Stay Resilient?
Azeez | 2026-03-29
Altcoins
Could SpaceX’s IPO Be the Catalyst That Sends Dogecoin Above $0.10?
Azeez | 2026-03-29