


Ethereum coin on textured surface. Source: TechGaged / Shutterstock
Ethereum Pattern Suggests Potential Move Toward $1K
In Brief
- • Ethereum shows a repeated bearish pennant breakdown.
- • Pattern projection suggests possible $1,000 retest.
- • Macro factors still influence the outcome.
Ad
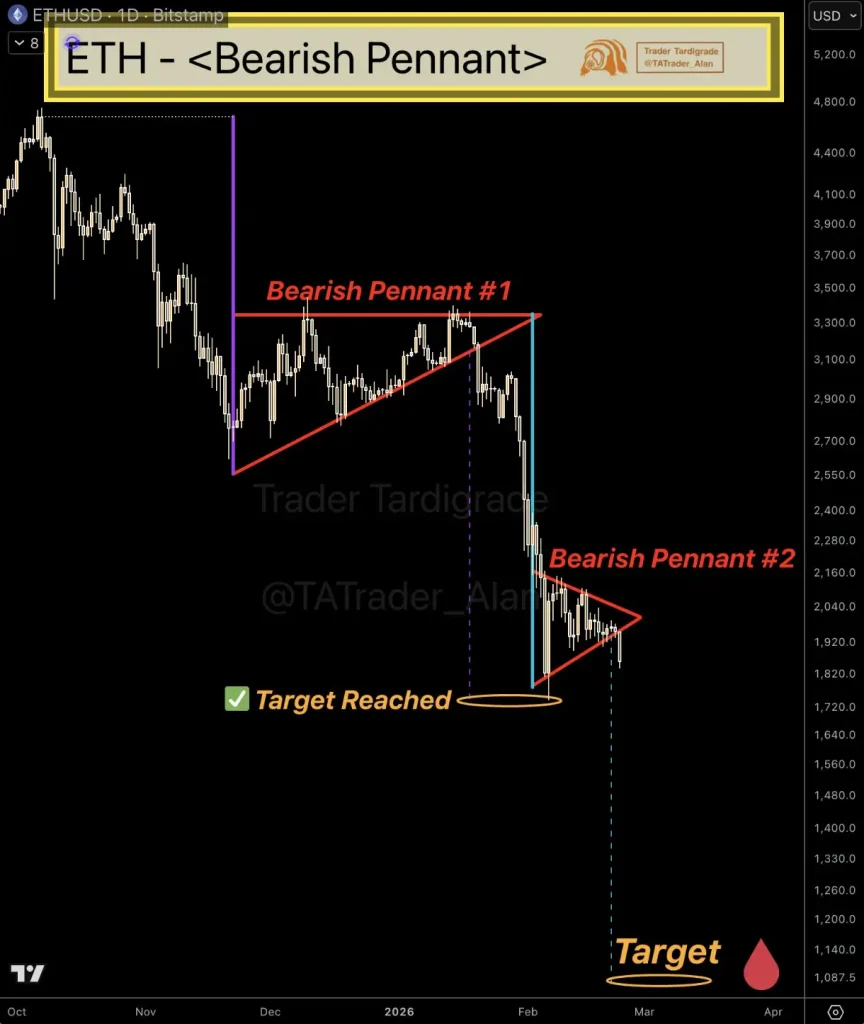
Ethereum (ETH) may be entering another technical breakdown phase after a second bearish pennant reportedly failed on the daily chart. The pattern mirrors an earlier setup that already played out during the recent selloff. The measured move now points toward a possible retest of the $1,000 region.
A Repeated Bearish Pattern On The Chart
Specifically, renowned cryptocurrency market expert Trader Tardigrade pointed to two similar pennant formations in his X post on February 24. Ethereum’s first bearish pennant formed after a sharp drop and eventually broke lower, with the price reaching a projected target near $1,735.
Now a second pennant has developed following another leg down. According to the chart analysis, the structure has already broken to the downside, suggesting continuation rather than consolidation.
Bearish pennants are continuation patterns that typically appear during downtrends. They form when price briefly compresses into a tightening range before resuming the prevailing direction.
The measured move in this case is derived from the length of the prior impulse drop. Applying the same projection to the latest breakdown yields a potential target slightly above $1,000.
Why Traders Are Watching This Setup
Pattern repetition tends to attract attention because markets often move in fractal-like structures. When a setup plays out cleanly once, traders frequently look for similar formations to gauge momentum and risk levels.
A move toward the $1,000 zone would mark a deeper retracement from recent highs and could reshape short-term sentiment around Ethereum. That level also sits near historically significant psychological support, which may increase volatility if approached.
Still, technical projections are not guarantees. Macro conditions, Bitcoin (BTC) direction, and liquidity flows continue to influence Ethereum’s trajectory alongside chart patterns.
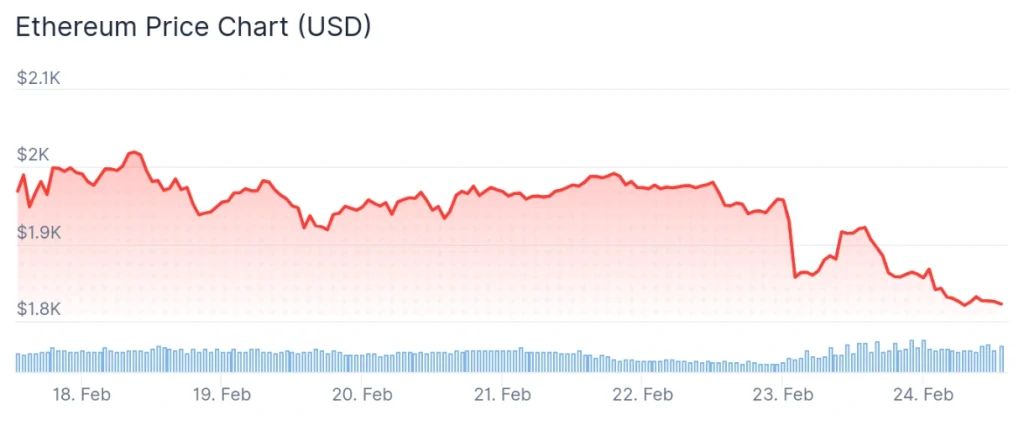
Currently, the price of Ethereum stands at $1,822.52, which represents a 5.1% decline in the last 24 hours, a drop of 7.4% over the past seven days, and an accumulated loss of 37.8% across the month, per the most recent chart information.
For now, the breakdown has placed a clear technical level on the radar. The subsequent move, be it the price accelerating toward the projected zone or stabilizing beforehand, may define Ethereum’s next major narrative in the current cycle.
More Must-Reads:
How do you rate this article?
Subscribe to our YouTube channel for crypto market insights and educational videos.


Join our Socials
Briefly, clearly and without noise – get the most important crypto news and market insights first.
Most Read Today
1
BlackRock’s Next Crypto Move Could Change Ethereum Investing Forever
2Arizona Just Put XRP on the Map, and the Ripple Effects Could Spread Fast
3Big Mining Firm Liquidates Its Entire Bitcoin Treasury
4Hyperliquid Founder: “Get Rich Quick” Is Killing Web3 – Here’s Why
5Vitalik Buterin Explains Why Crypto Can Never Be Fully Secure
Latest


8
Also read
Similar stories you might like.

Altcoins
DOGE-BTC Ratio Triggers Historic Cycle Signal; Major Shift In The Making
Ana | 2026-02-24

Altcoins
Analyst Links XRP Reserve Push To Liquidity Crisis; Here’s Why
Ana | 2026-02-24

Bitcoin
Bitcoin Vs Gold Ratio Near 2022 Bear Market Levels; What Next?
Ana | 2026-02-24

Industry
Ukraine And Baltics Bust Crypto Scam Ring Targeting EU Investors
Ana | 2026-02-24

Altcoins
XRP Fear Peaks As Analyst Sees Bottom Forming
Ana | 2026-02-23

Bitcoin
‘Rich Dad’ Robert Kiyosaki Adds Another Bitcoin During Crash, Explains Why
Ana | 2026-02-23

Bitcoin
Analyst Says Bitcoin Could Replace Private Credit – This Is How
Ana | 2026-02-23

Blockchain
Hyperliquid Founder: “Get Rich Quick” Is Killing Web3 – Here’s Why
Ana | 2026-02-23

Blockchain
Vitalik Buterin Explains Why Crypto Can Never Be Fully Secure
Ana | 2026-02-23

Altcoins
Ethereum Fractal Is “Screaming,” Suggests Explosive Rally Ahead
Ana | 2026-02-20