


Zooming out, Bitcoin’s historical cycle still shows signs of continuation.
Bitcoin Structure Suggests Four-Year Cycle Still Has Room
In Brief
- • Bitcoin’s long-term chart still supports the four-year cycle view.
- • Recent volatility hasn’t confirmed a cycle breakdown.
- • The yearly close remains the key signal.
Ad
As short-term volatility dominates headlines, long-term Bitcoin (BTC) watchers are shifting focus to the yearly chart, where one cryptocurrency analyst has observed that claims regarding Bitcoin’s four-year cycle as “broken” may be premature.
Specifically, prominent crypto trading expert EGRAG CRYPTO pointed out that viewing Bitcoin through a longer lens changes the perspective, showing signs that the four-year cycle is still developing, according to the analysis he shared on February 4.
What The Yearly Chart Shows
EGRAG points to a recurring rhythm in Bitcoin’s history: three green yearly candles followed by one red candle, a pattern that has held for more than a decade.
In the 2013-2017 cycle, it delivered three green years, in 2018 it printed a single red year, in the 2019-2021 period it again produced three green candles, and then 2022 marked the next red year.
That structure underpins the widely referenced four-year Bitcoin cycle. The current debate stems from the most recent sequence: 2023 closed green, 2024 closed green, whereas 2025 finished red. Prompting claims that the cycle has failed.
However, 2026 is still developing. On a yearly timeframe, early volatility doesn’t determine the final candle color.
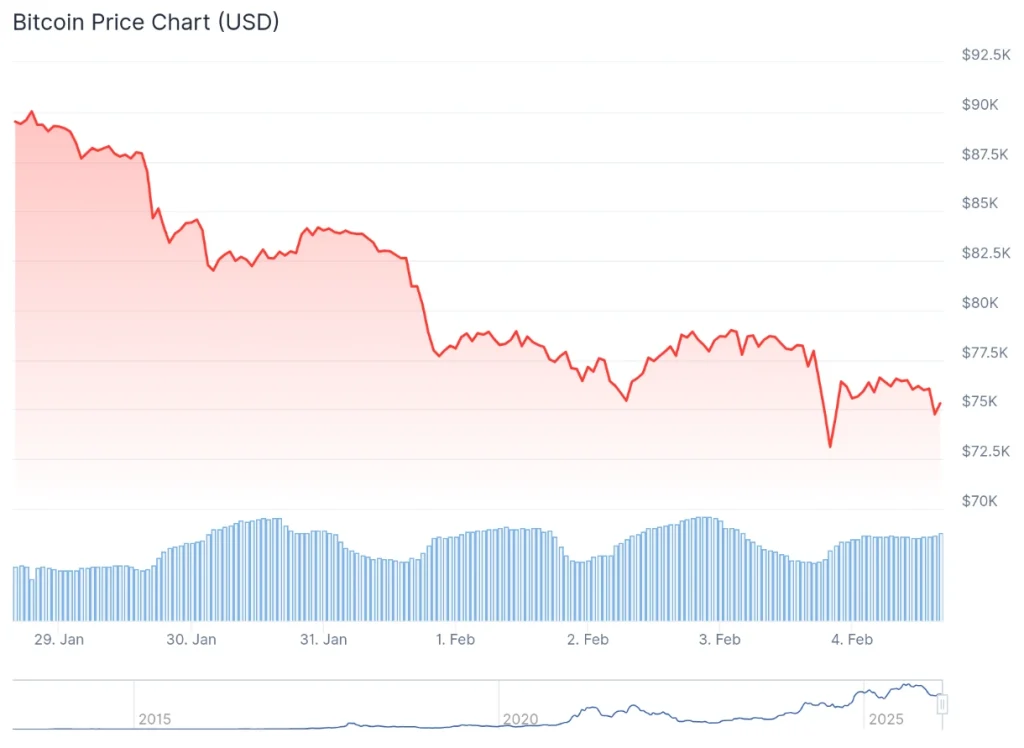
Indeed, BTC is right now changing hands at $75,346.58, down 3.3% on the day, dipping 15.9% across the week, and losing 19.5% over the past month, according to the most recent price chart information.
Why A “Broken Cycle” Isn’t Confirmed
EGRAG argues that declaring the cycle broken assumes Bitcoin has shifted to a two-year bull / two-year bear structure, a theory with no historical precedent.
From a time-and-structure perspective, he suggests 2026 still favors a green close, even if sharp pullbacks continue along the way. In this framework, volatility is treated as movement within a bull cycle rather than evidence of a completed top.
Cycles, he notes, do not end on fear alone. They tend to resolve when time, structure, and broad acceptance align, which are the conditions he argues have not yet appeared.
The yearly chart forces patience. It removes intraday emotion and compresses market psychology into a single data point per year. Viewed this way, Bitcoin’s long-term rhythm remains under pressure, but not invalidated.
For now, the chart is asking the same thing it always does: wait for confirmation, not consensus.
Bitcoin Price Today
More Must-Reads:
How do you rate this article?
Subscribe to our YouTube channel for crypto market insights and educational videos.


Join our Socials
Briefly, clearly and without noise – get the most important crypto news and market insights first.
Most Read Today
1
Crypto Trading Volume Collapse: March on Track for Worst Month Since 2020
2SEC Move Opens New Phase For Bitcoin And Ethereum ETFs
3Bitcoin Crash Fears Return as Market Pressure Builds
4New Threat to Prediction Markets as U.S. Crackdown Expands
5SEC Opens Door for Tokenized Stocks on Nasdaq – A Major Shift for Wall Street
Latest


8
Also read
Similar stories you might like.

Market
A Healthy Pullback Or Something More — What Drove Crypto Markets This Week
Sead | 2026-03-23

Bitcoin
Bitcoin Supply Shift Raises New Questions Across Market
Ana | 2026-03-23

Market
Crypto Trading Volume Collapse: March on Track for Worst Month Since 2020
Jastra | 2026-03-23

Industry
U.S. Crypto Regulation Breakthrough Pushes Clarity Act Closer to Reality
Ana | 2026-03-23
Bitcoin
Bitcoin Crash Fears Return as Market Pressure Builds
Ana | 2026-03-23

Industry
New Threat to Prediction Markets as U.S. Crackdown Expands
Rokas | 2026-03-23

Defi
SEC Move Opens New Phase For Bitcoin And Ethereum ETFs
Rokas | 2026-03-23
Altcoins
$3B in RWA TVL and Counting: Can BNB Flip Solana’s Crown?
Azeez | 2026-03-22
Altcoins
Goldman Sachs Is XRP’s Biggest ETF Buyer — What the Pros See That Retail Might Be Missing
Azeez | 2026-03-22

Altcoins
Cardano’s $10 Million Question: Will Bulls Survive the Liquidity Sweep?
Azeez | 2026-03-22